Following along? Open the live page
Finmagine — free to explore • premium for full access • no app needed
After reading this guide you will be able to:
- Read the Returns sub-tab — price performance charts, monthly seasonality, and SIP simulation
- Interpret Delivery % to distinguish genuine accumulation from intraday speculation
- Spot institutional activity using Bulk & Block Deals — who bought, who sold, at what price
- Analyse the Shareholding Pattern — promoter pledging, FII/DII trends, and public float changes
- Use the Dividends history to assess payout consistency and yield sustainability
- Understand corporate actions — Splits & Bonus Issues — and their impact on your holdings
- Navigate the News sub-tab to filter NSE filings by category and spot material events early
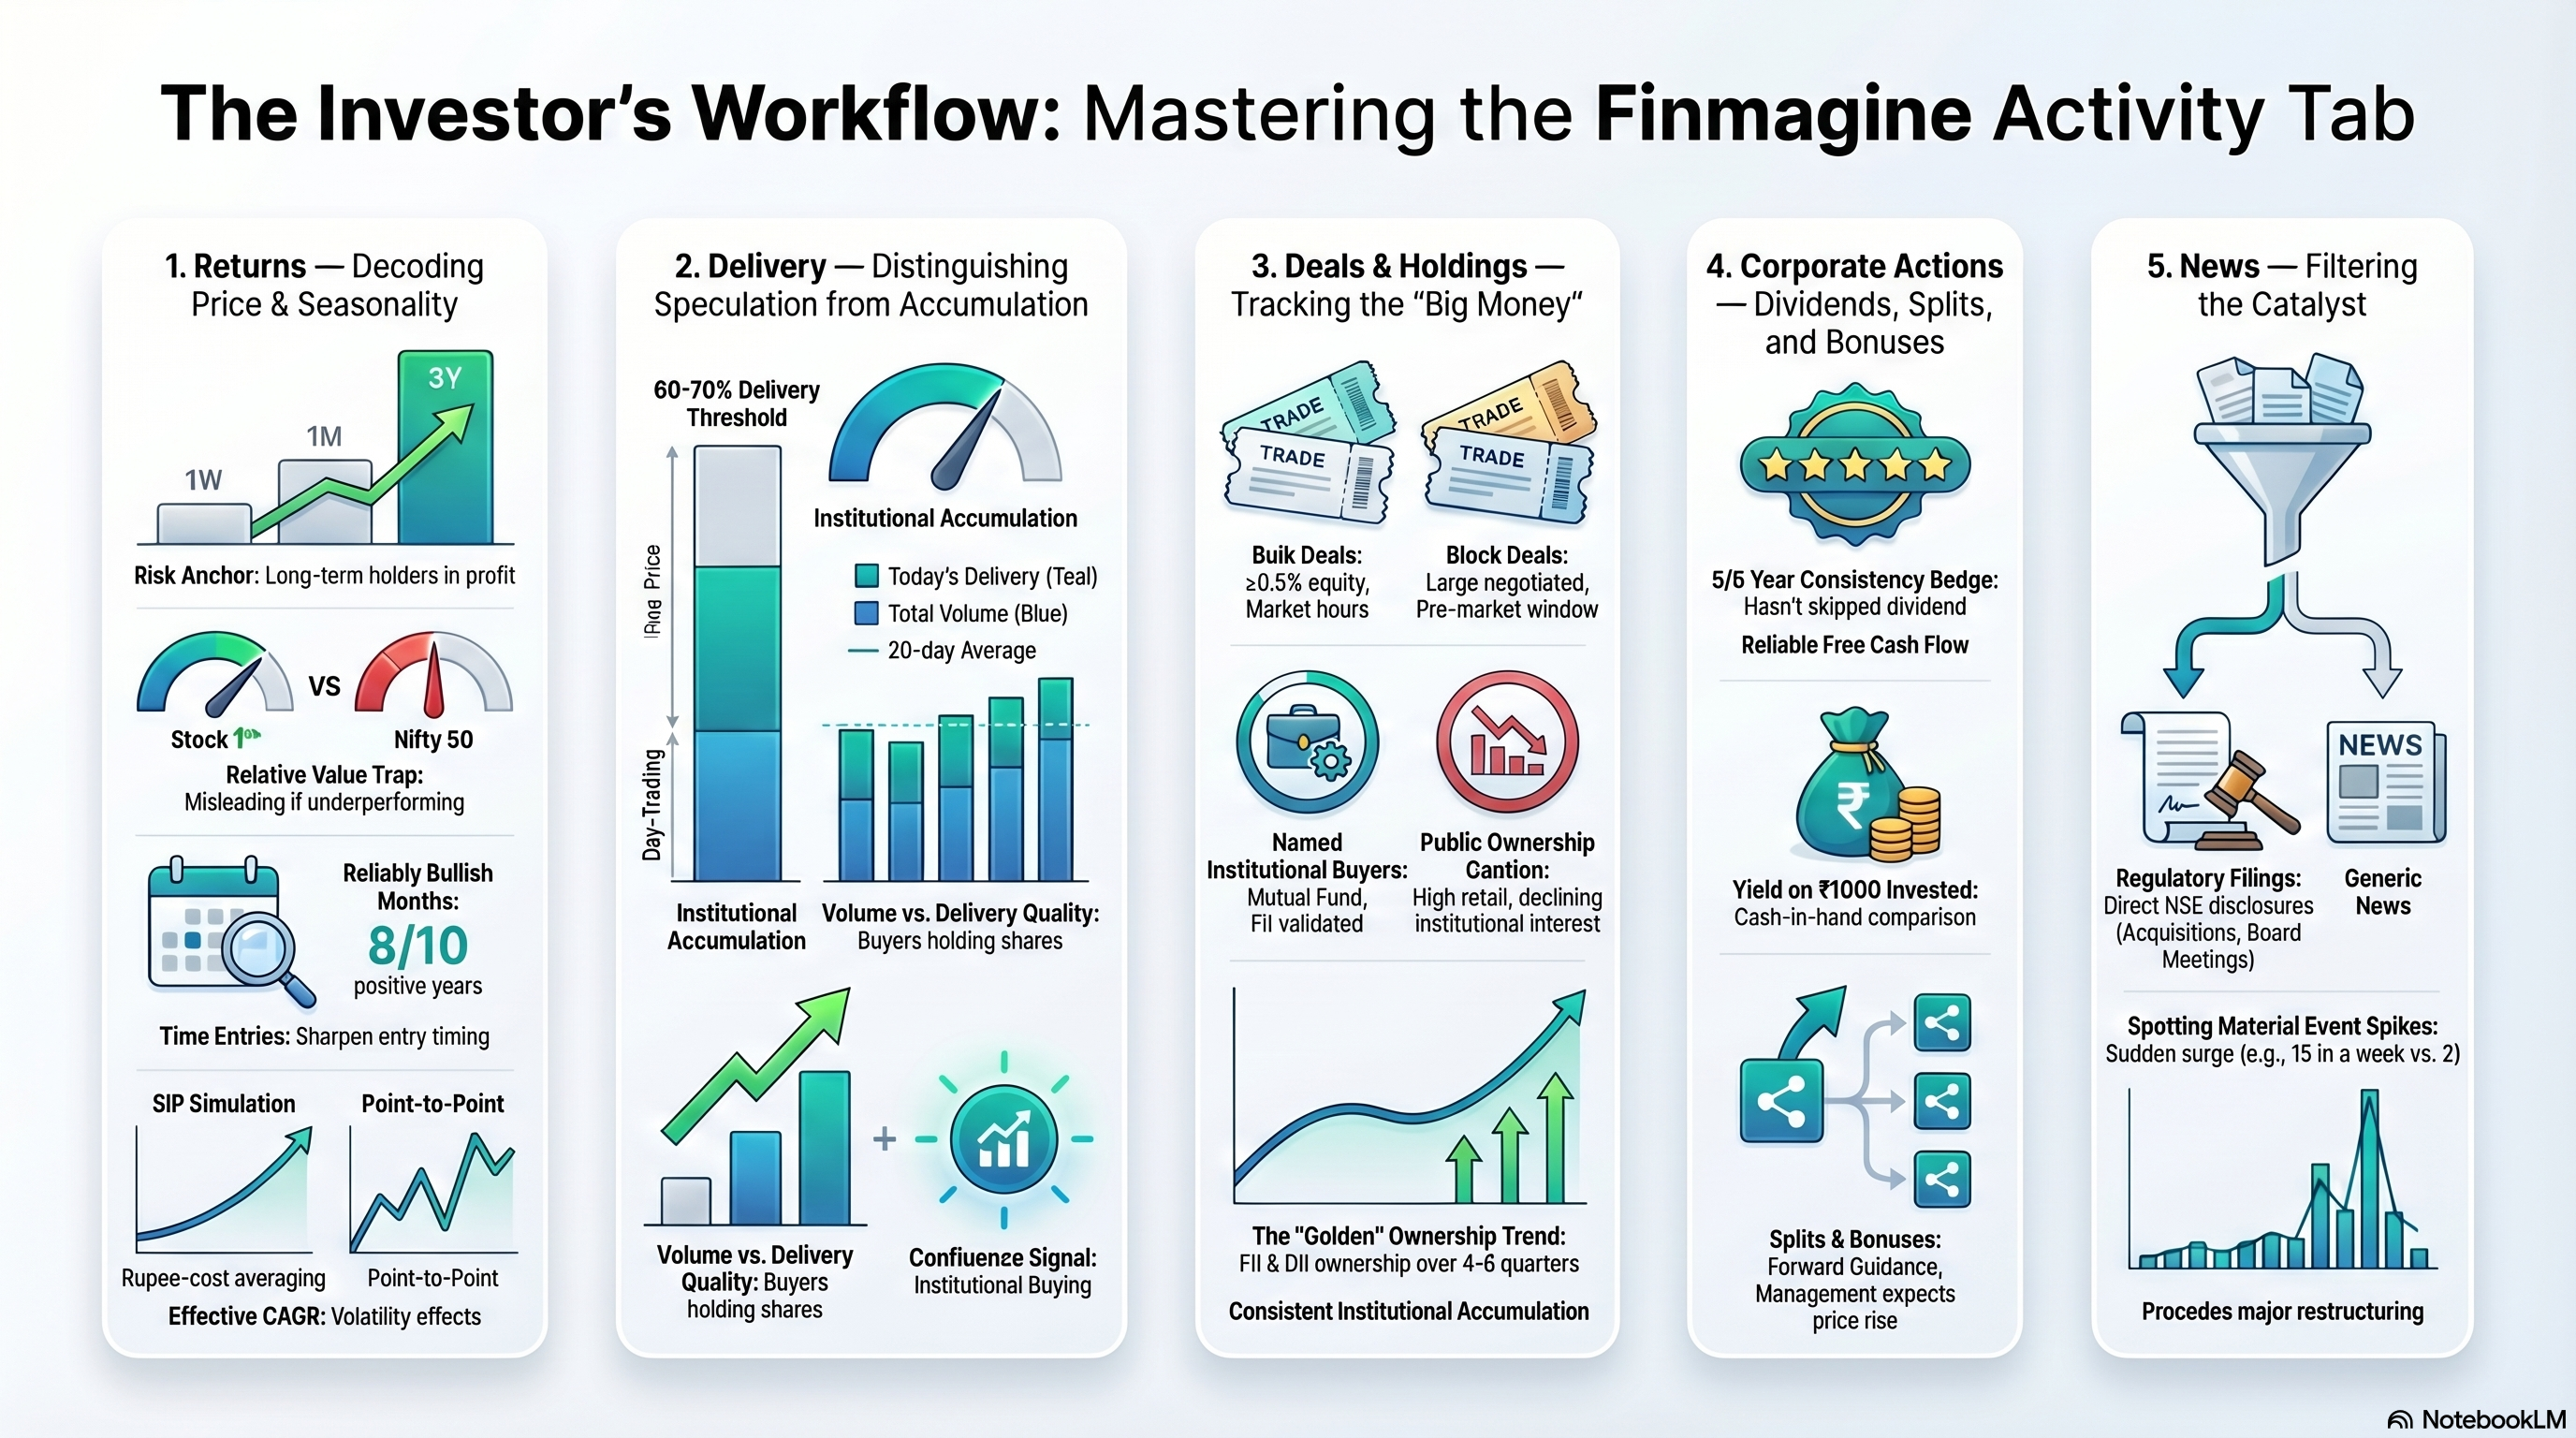
📌 Seven sub-tabs, one workflow
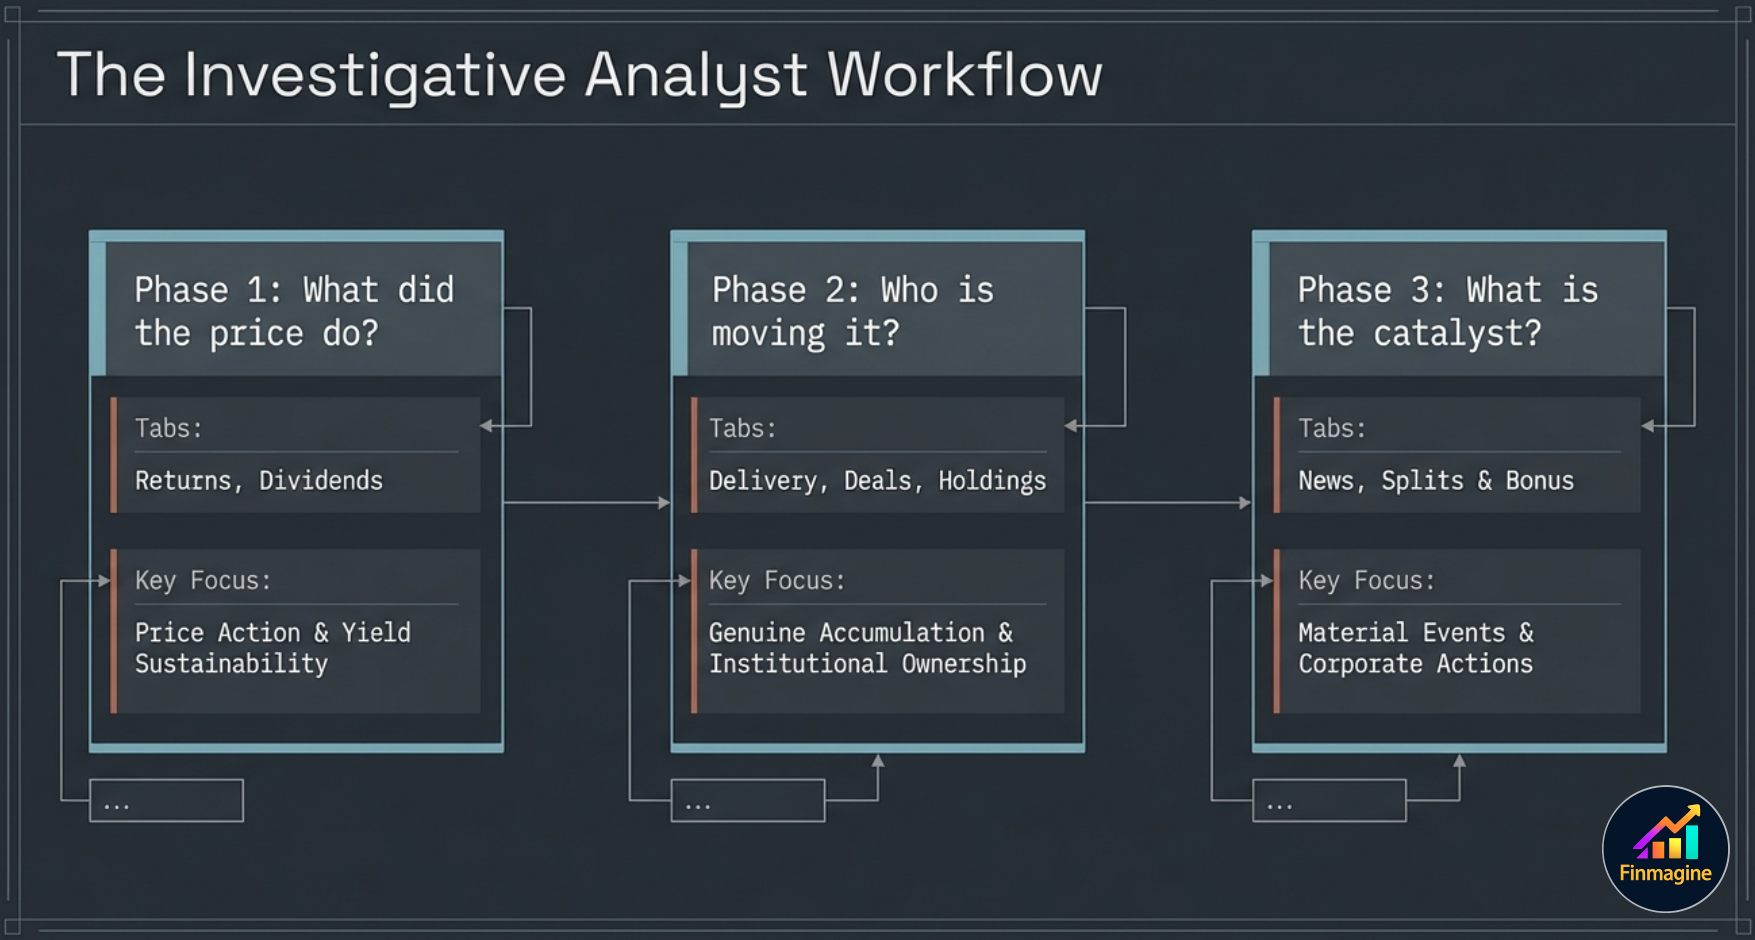
The Activity tab aggregates data that most investors check across four different websites. Returns + Delivery tell you what the price did and why. Deals + Holdings tell you who is buying or selling. Dividends + Splits tell you what the company is returning to shareholders. News ties it all together with the catalyst.
Watch the complete 7-step framework walkthrough, then listen to the in-depth podcast-style analysis:
🎧 Audio Deep Dive — 7-Step Institutional Analysis
A podcast-style breakdown of all seven sub-tabs and the workflow that connects them. Good for commutes or as revision after reading the guide.
1. The Activity Tab at a Glance
The Activity tab is the most data-dense part of a company page. It covers everything that happens around a stock — price behaviour, trading patterns, institutional ownership, corporate actions, and news — in a single organised view.
The tab is split into ten sub-tabs. This guide covers the seven data sub-tabs:
The three governance signal sub-tabs (Pledging, SAST, Insider) are covered in a separate dedicated guide because they require a different interpretive framework — they are about management behaviour rather than market activity.
2. Returns — Price Performance & Seasonality
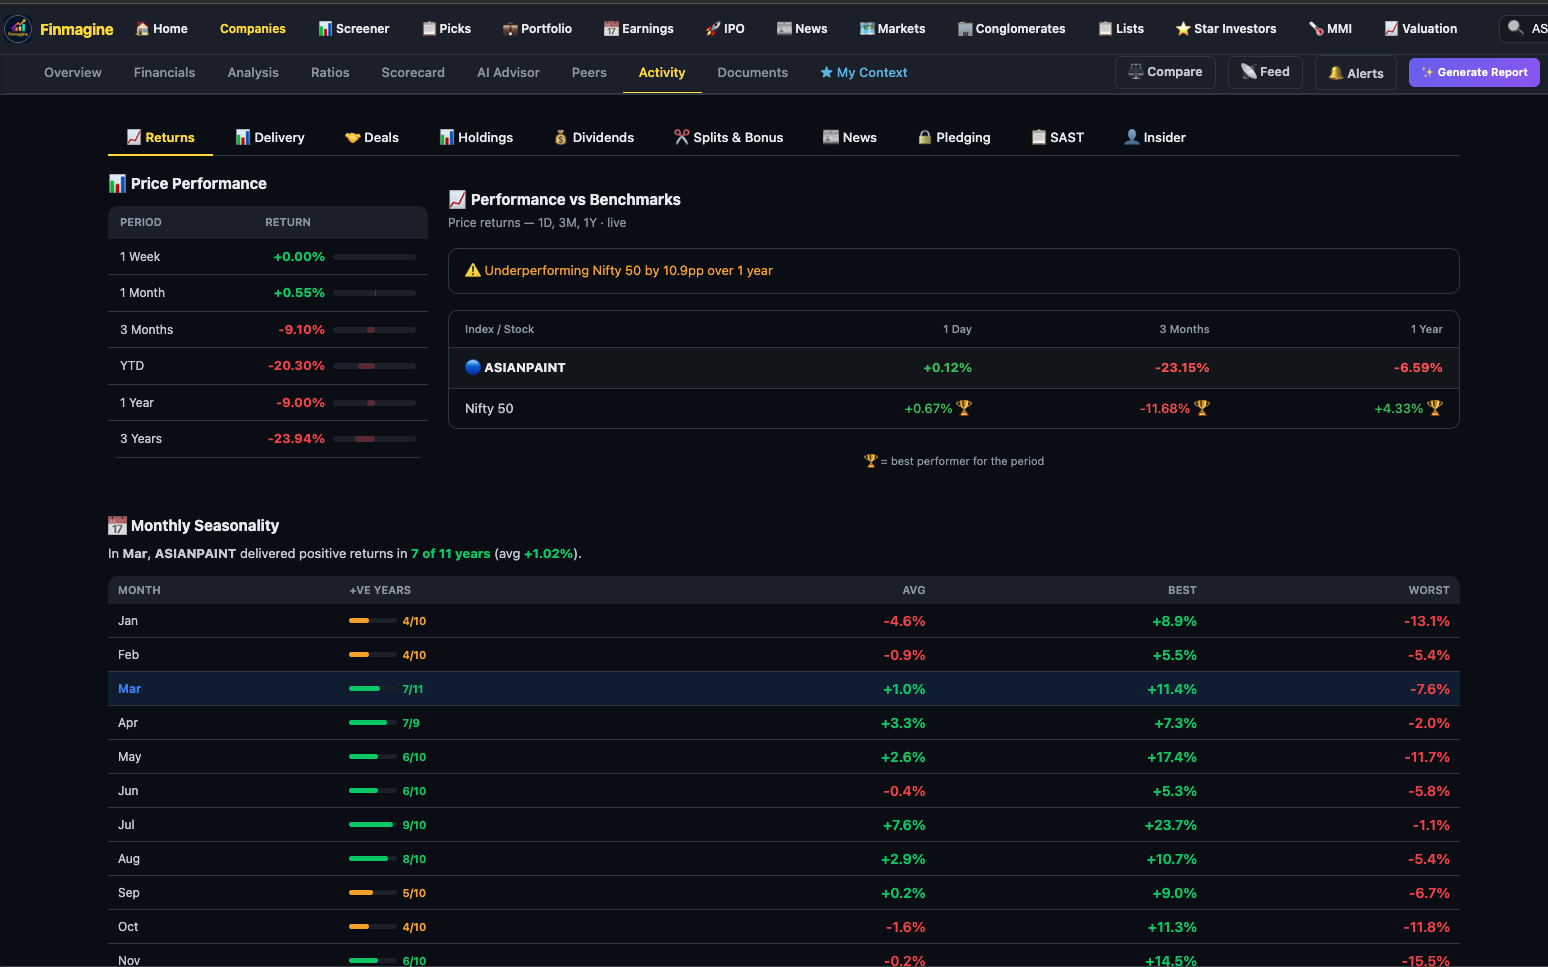
Price Performance
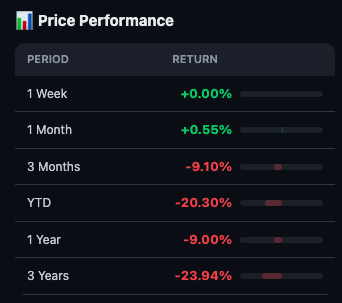
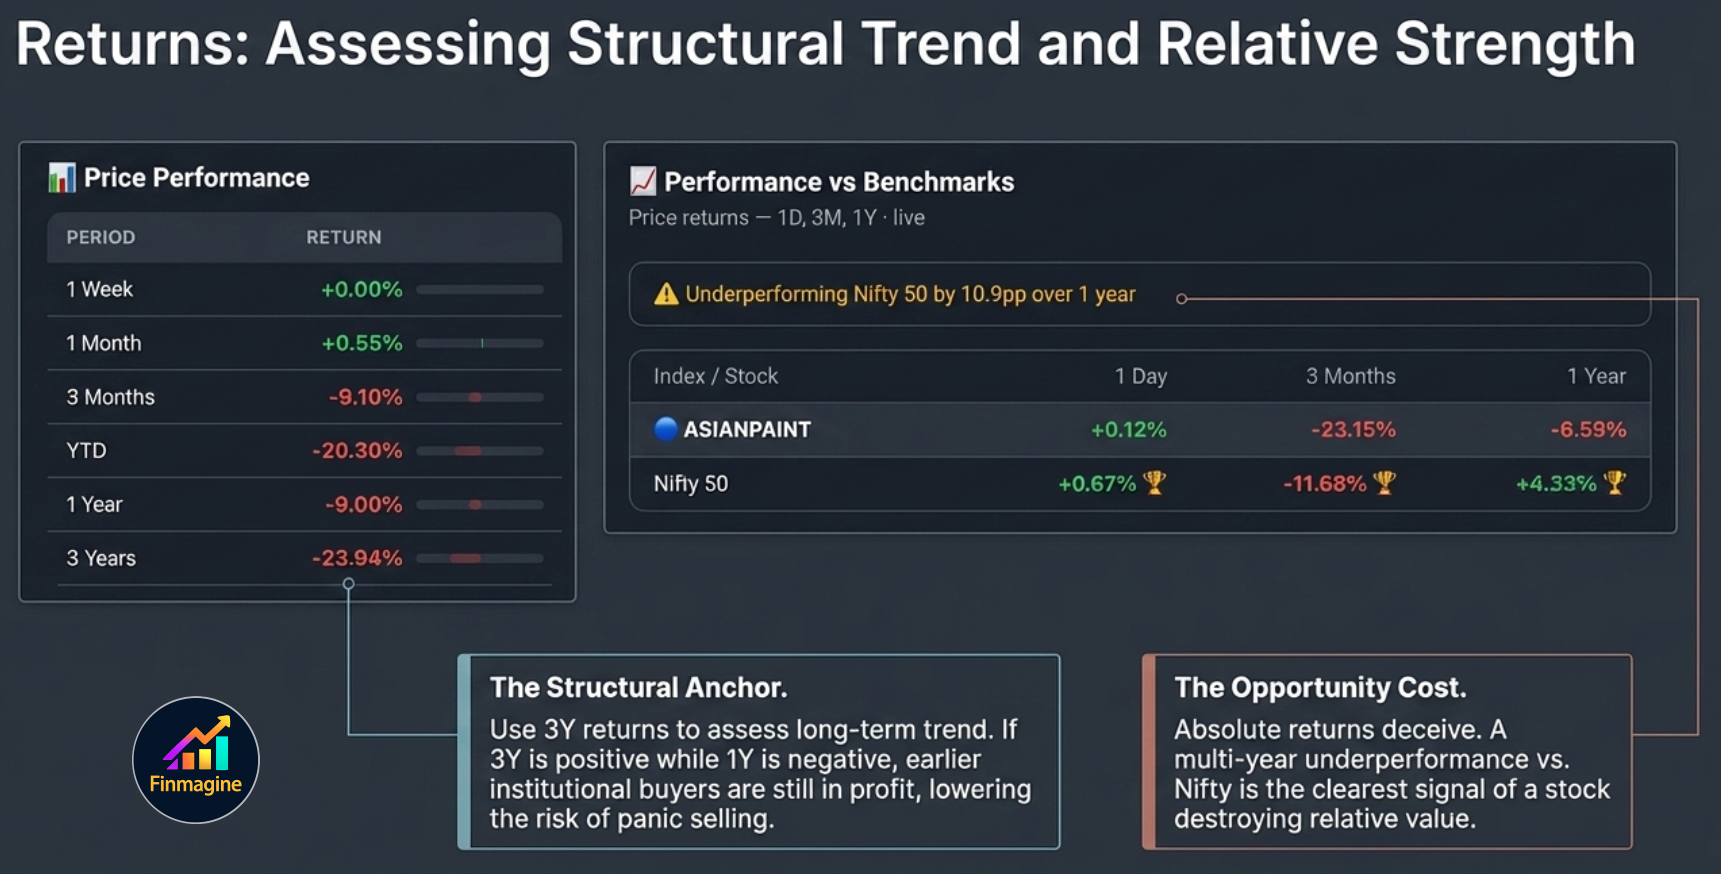
The Price Performance widget shows returns at six horizons: 1W, 1M, 3M, YTD, 1Y, and 3Y. Bars are red for negative, green for positive, and scale proportionally so you can immediately see which horizon is worst.
Read this widget left to right — short-term to long-term. A stock that is down 1W but up 3Y is in a temporary correction within a long-term uptrend. A stock down on every horizon is in structural decline.
Benchmark Comparison
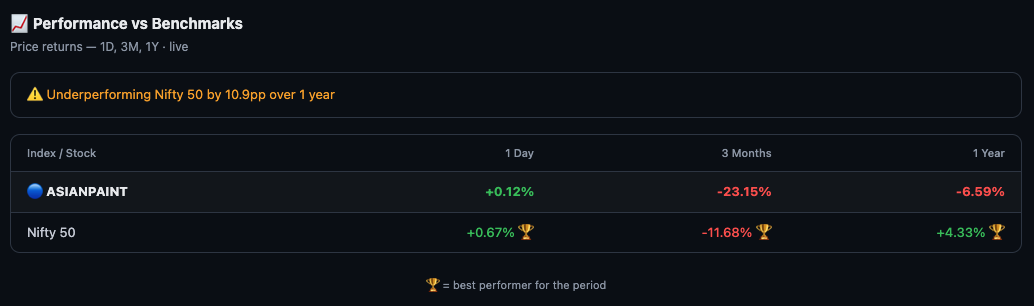
Absolute returns are only half the story. A +12% return looks great until you see the Nifty 50 returned +23% in the same period — you would have done better in an index fund.
The Benchmark Comparison table shows your stock vs Nifty 50 at 1D, 3M, and 1Y. When underperformance exceeds a threshold, Finmagine surfaces an alert so you cannot miss it. This matters most for long-term holders reviewing whether a stock deserves continued conviction.
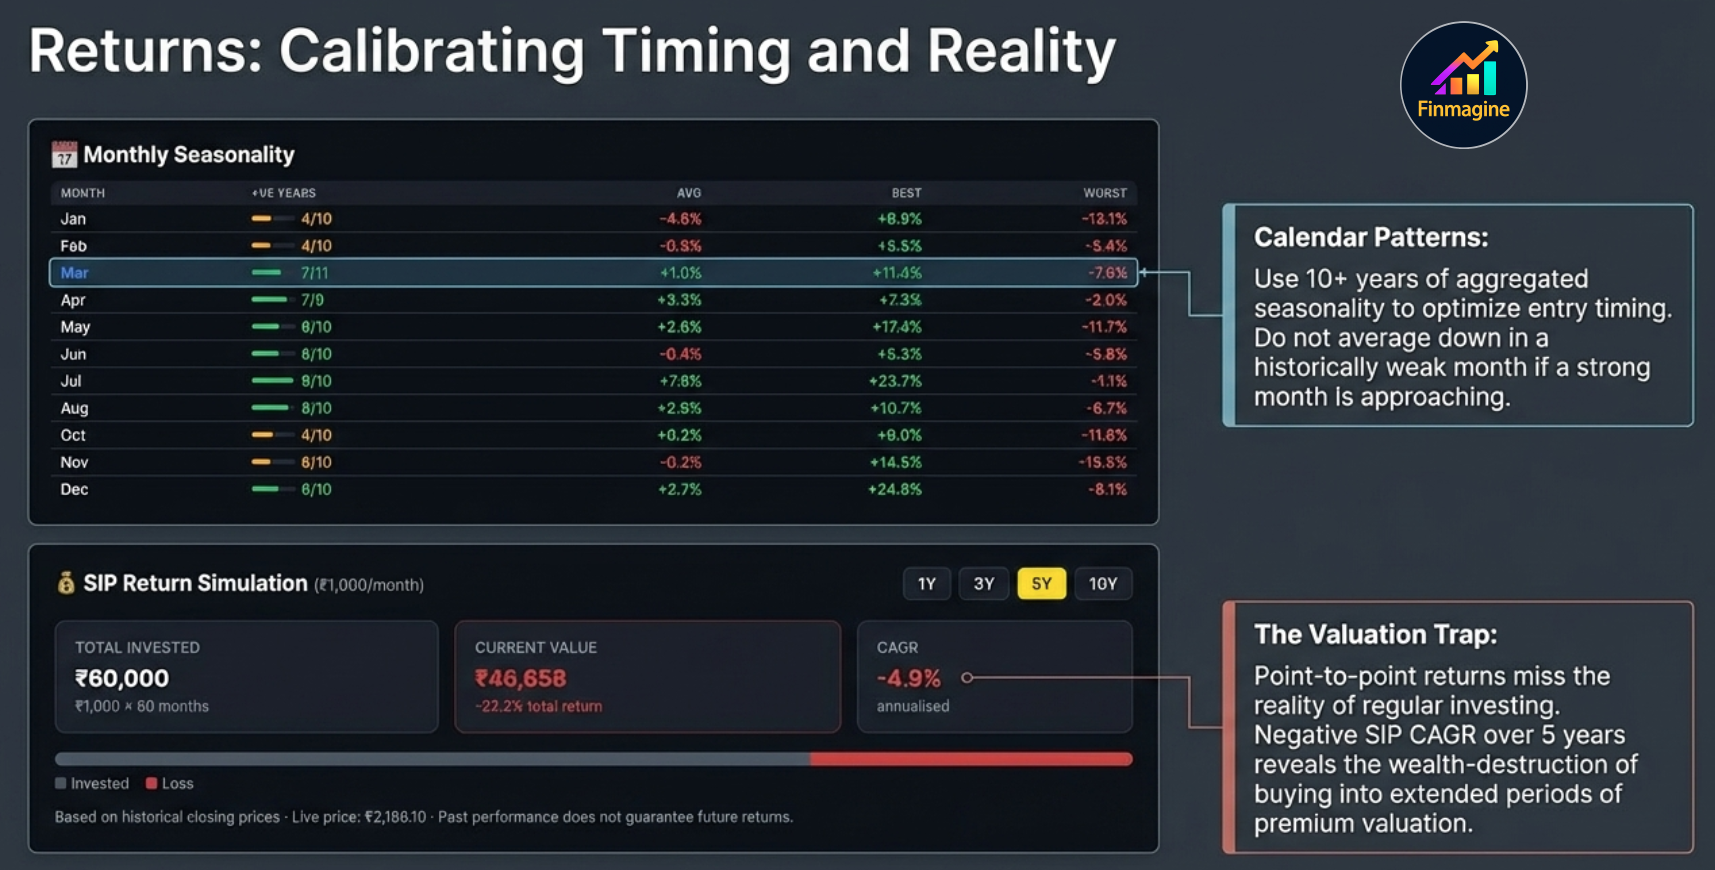
Monthly Seasonality
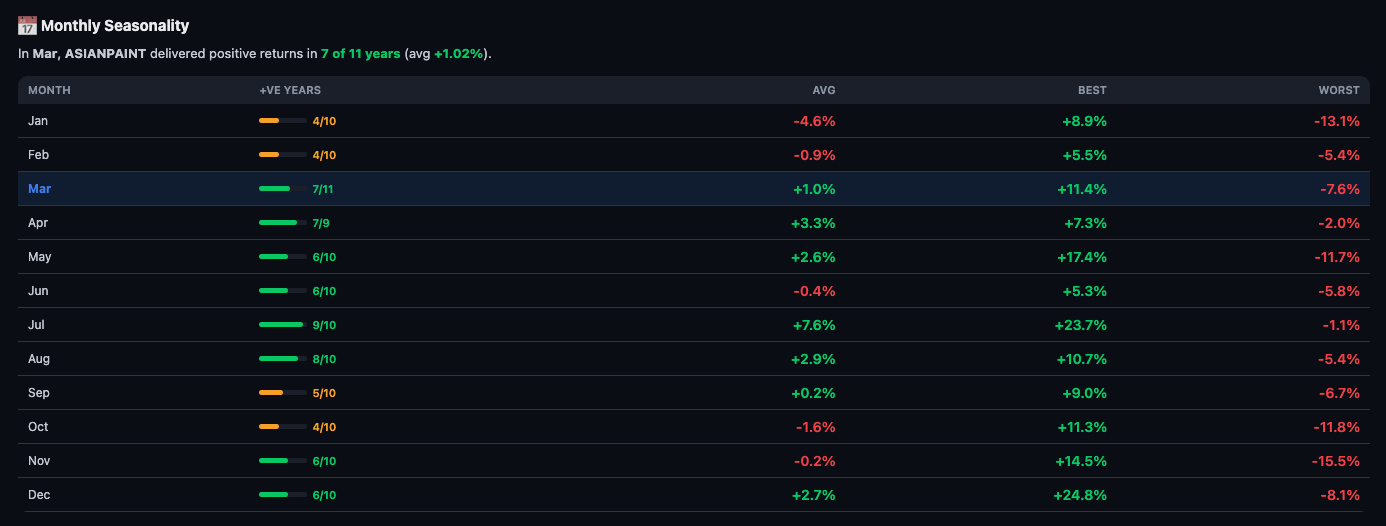
Monthly Seasonality aggregates 10+ years of monthly returns and asks: does this stock have consistent calendar patterns?
The grid shows each month's average return, the number of years that month ended positive, and the best and worst single-month outcome. A month with avg +3% and 8/10 positive years is reliably bullish. A month with avg -2% and only 3/10 positive years is reliably weak.
SIP Simulation
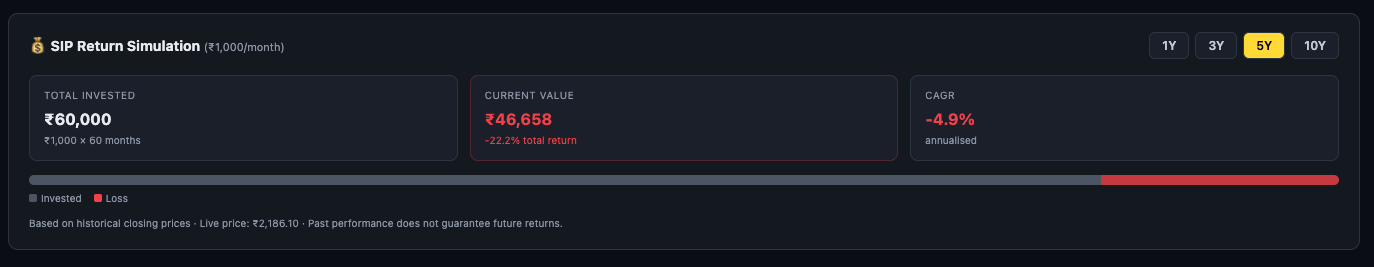
The SIP Simulation answers a question that point-to-point return calculations miss: if I had invested a fixed amount every month, what would I have today?
Because SIPs buy at different prices over time, the outcome can differ significantly from both the starting and ending price. A stock that was expensive at your SIP start date will show poor CAGR even if it recovers. A volatile stock that falls then rises will show strong SIP CAGR due to rupee-cost averaging.
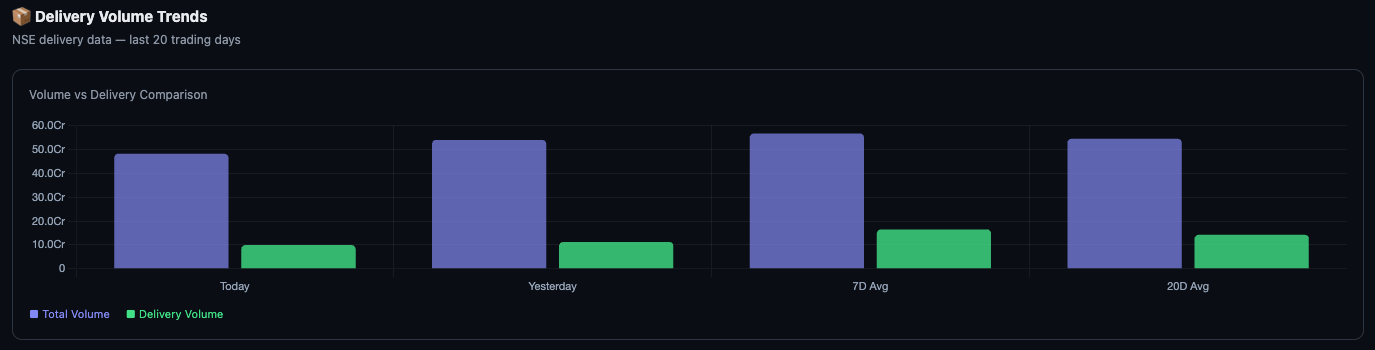
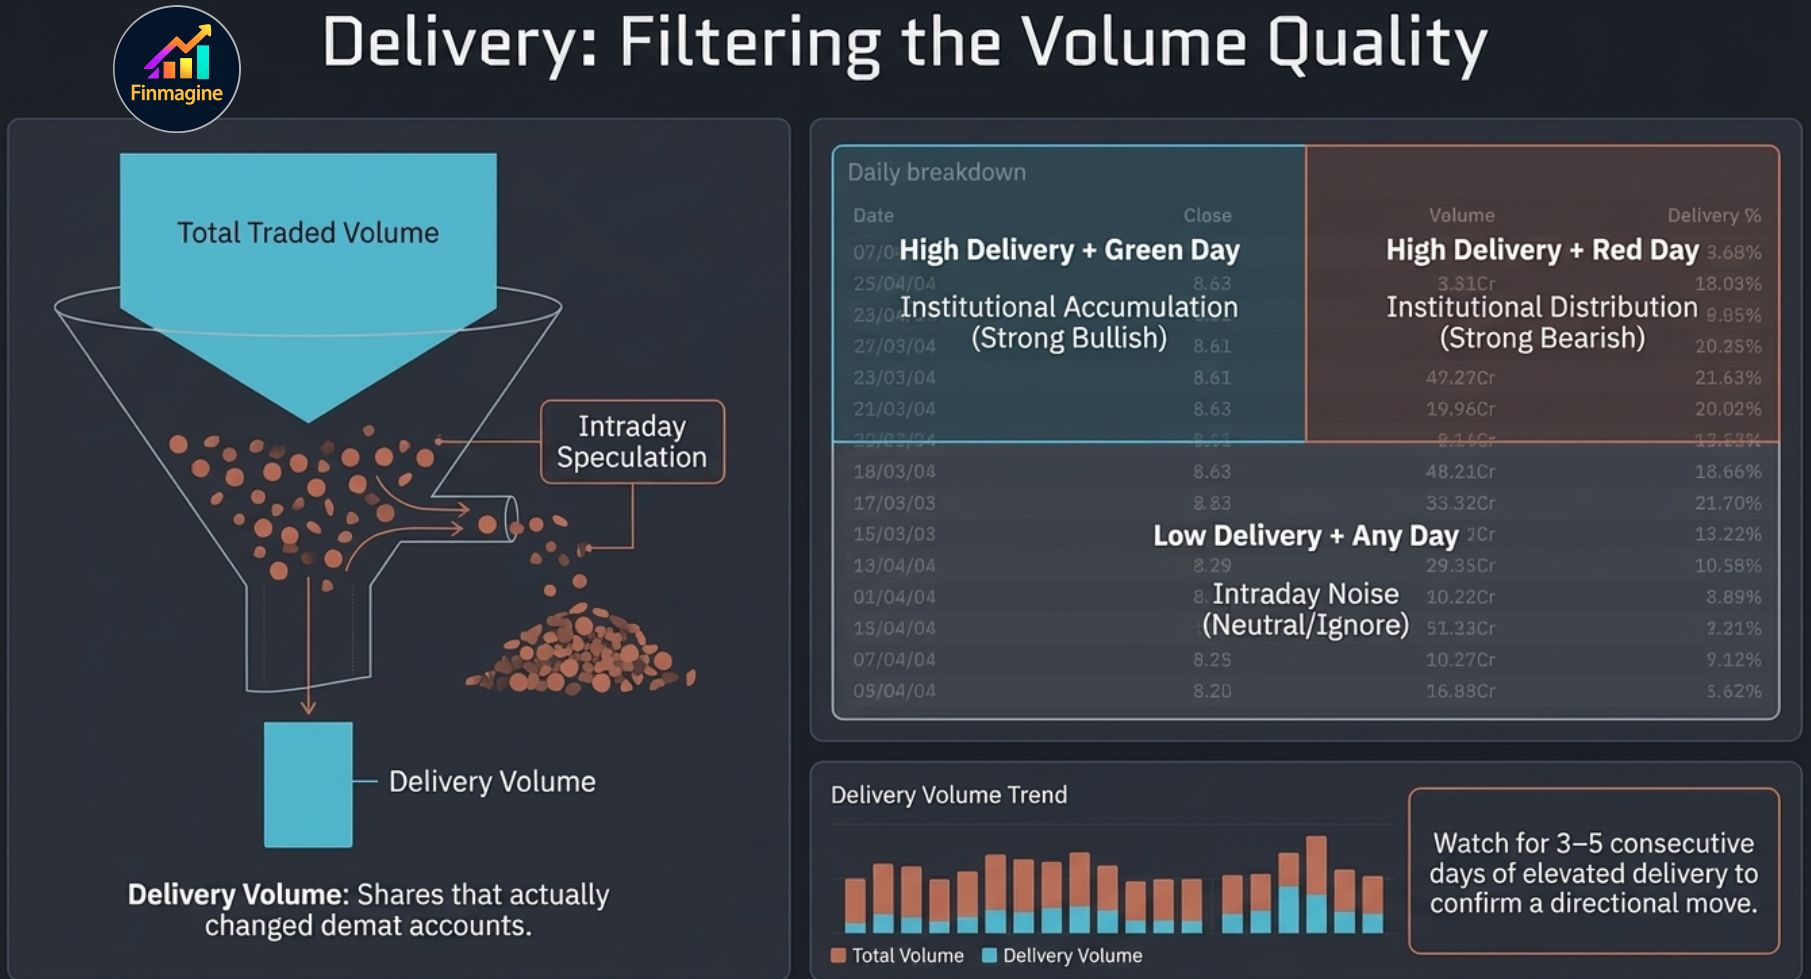
3. Delivery — Volume Quality Analysis
NSE discloses delivery data for every stock every day. Delivery volume is the portion of trades where shares actually moved between demat accounts — as opposed to intraday trades that net to zero. Finmagine surfaces this as a percentage and trend.
Reading the Stats Bar
A delivery % of 20–25% on a large-cap is typical for a quiet day. Spikes above 60–70% on above-average volume signal institutional buying — someone is accumulating real positions, not just intraday speculating.
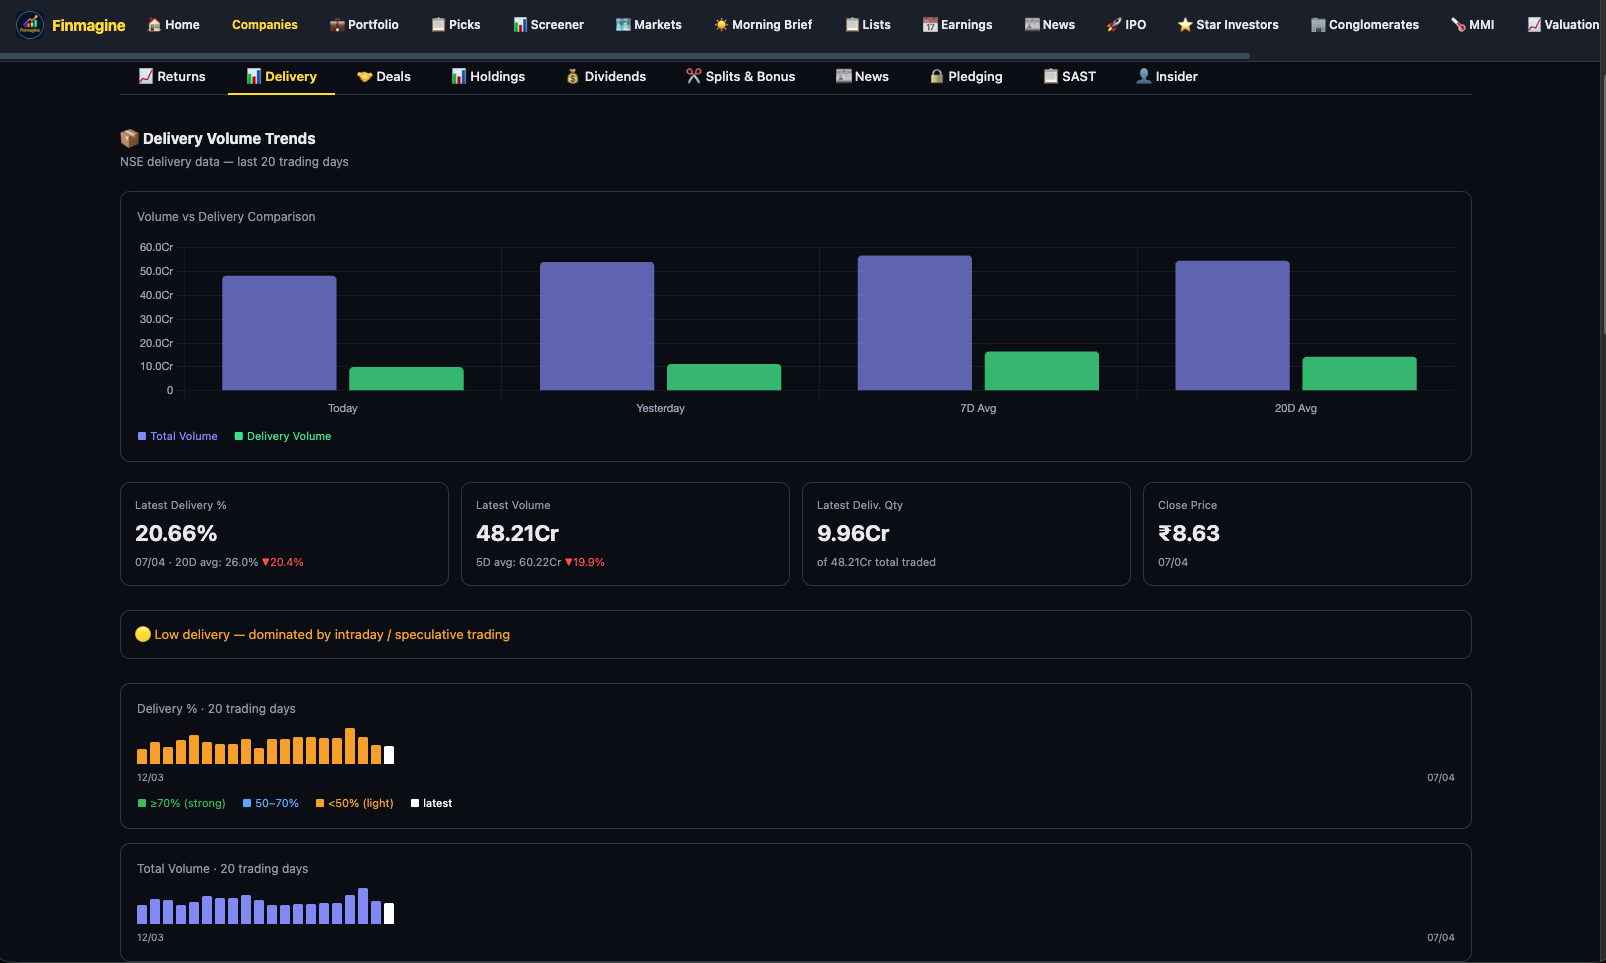
Volume vs Delivery Comparison
The bar chart pairs total volume (blue) and delivery volume (teal) across four periods: Today, Yesterday, 7-day average, and 20-day average. This lets you immediately answer three questions:
- Is today's volume unusual? Compare Today vs 20-day avg.
- Is delivery quality improving? If teal is growing relative to blue, more buyers are holding overnight.
- Is this a trend or a one-day spike? Check 7-day avg delivery vs 20-day avg.
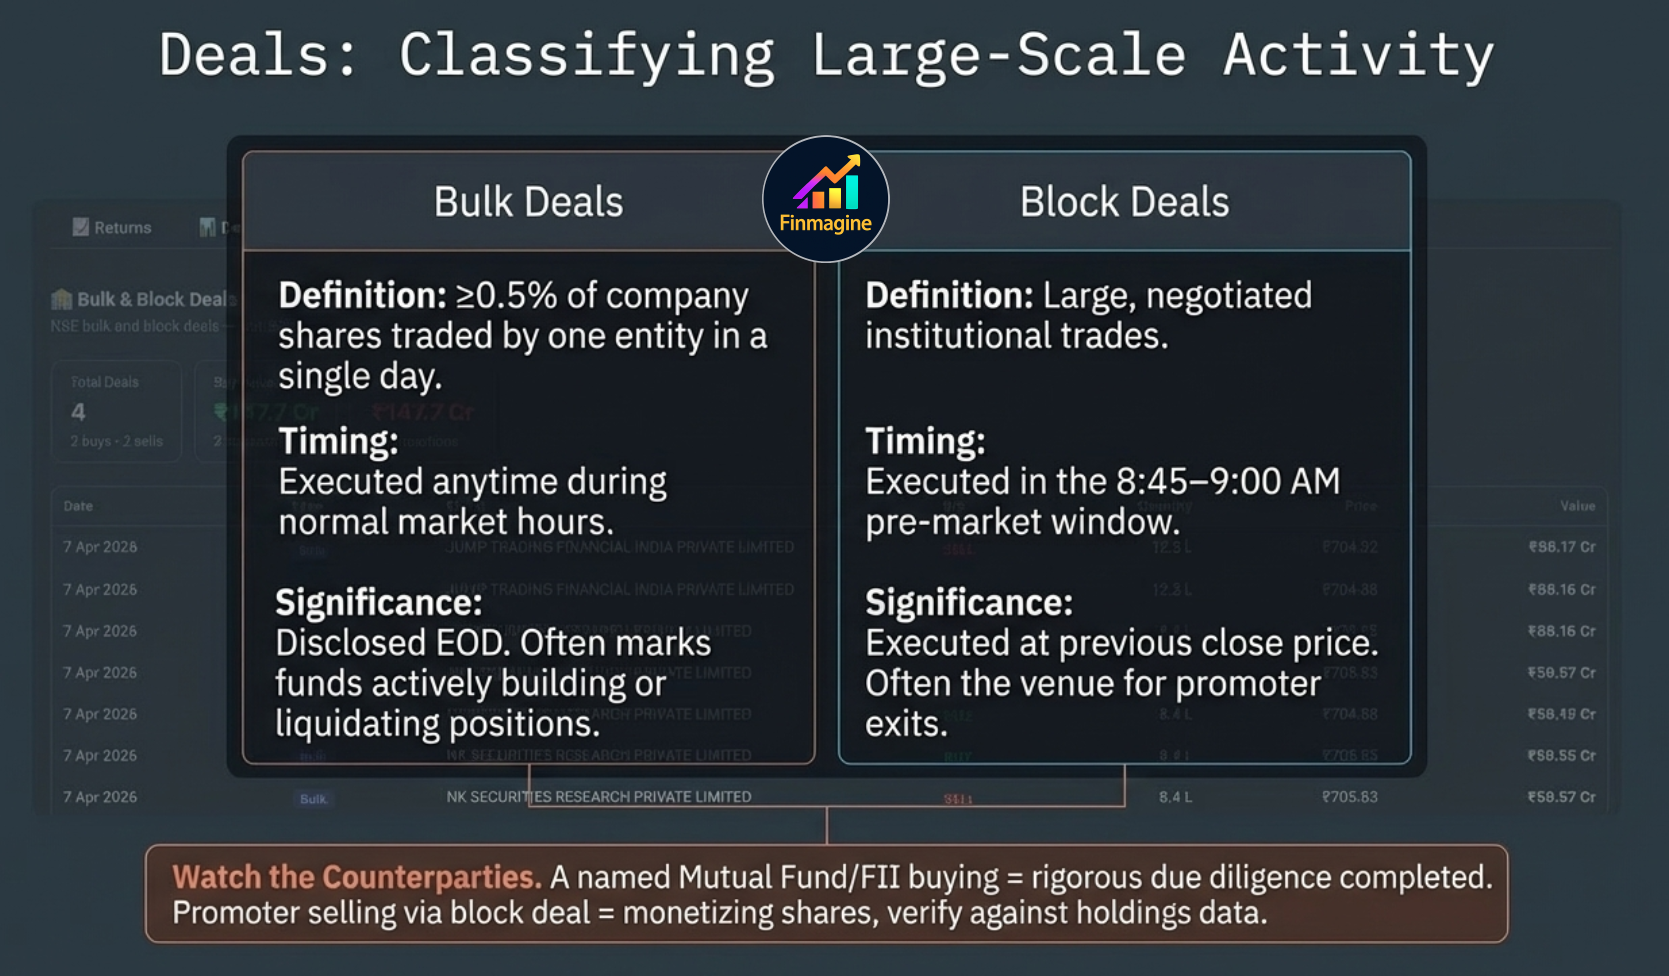
4. Deals — Bulk & Block Trade History
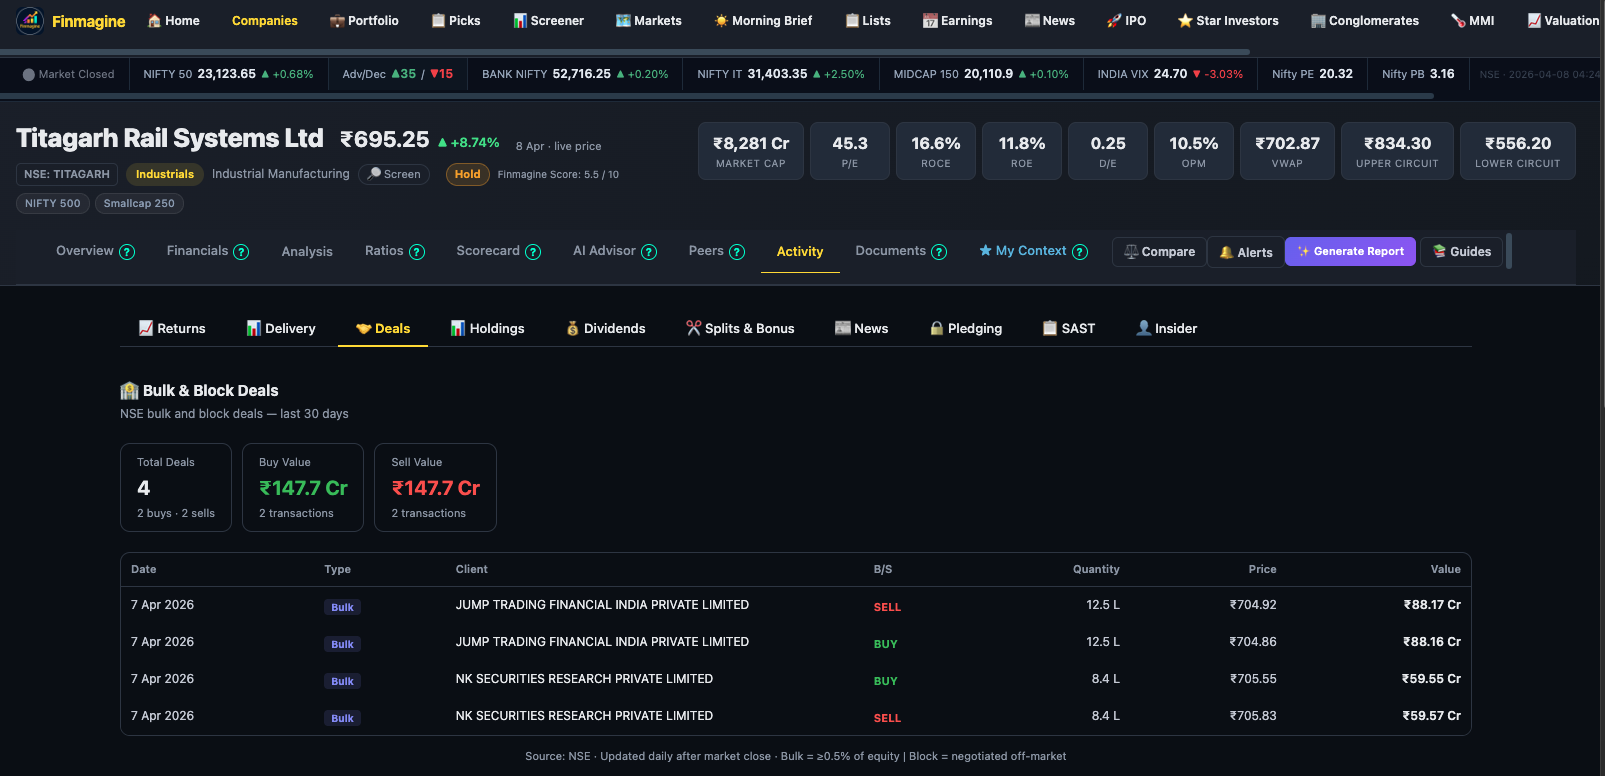
NSE mandates disclosure of bulk deals (≥0.5% of equity in a day by a single entity) and block deals (large negotiated trades in the pre-market window). These are some of the most valuable data points in the Activity tab because they tell you who is buying or selling in size.
Bulk vs Block Deals
| Type | Definition | Timing | Significance |
|---|---|---|---|
| Bulk | ≥0.5% of company shares by one entity in a single day | Any time during market hours | Disclosed end of day. Often funds entering/exiting positions. |
| Block | Large negotiated trades between institutions | Pre-market window 8:45–9:00 AM | Negotiated at previous close price. Promoter exits often happen here. |
How to Read the Deals Table
Each row shows: date, deal type, buyer entity, seller entity (if disclosed), quantity traded, average price, and total deal value in crore. When an entity shows as "—" it means the counterparty was not required to disclose or traded in smaller lots.
5. Holdings — Shareholding Pattern & Institutional Ownership
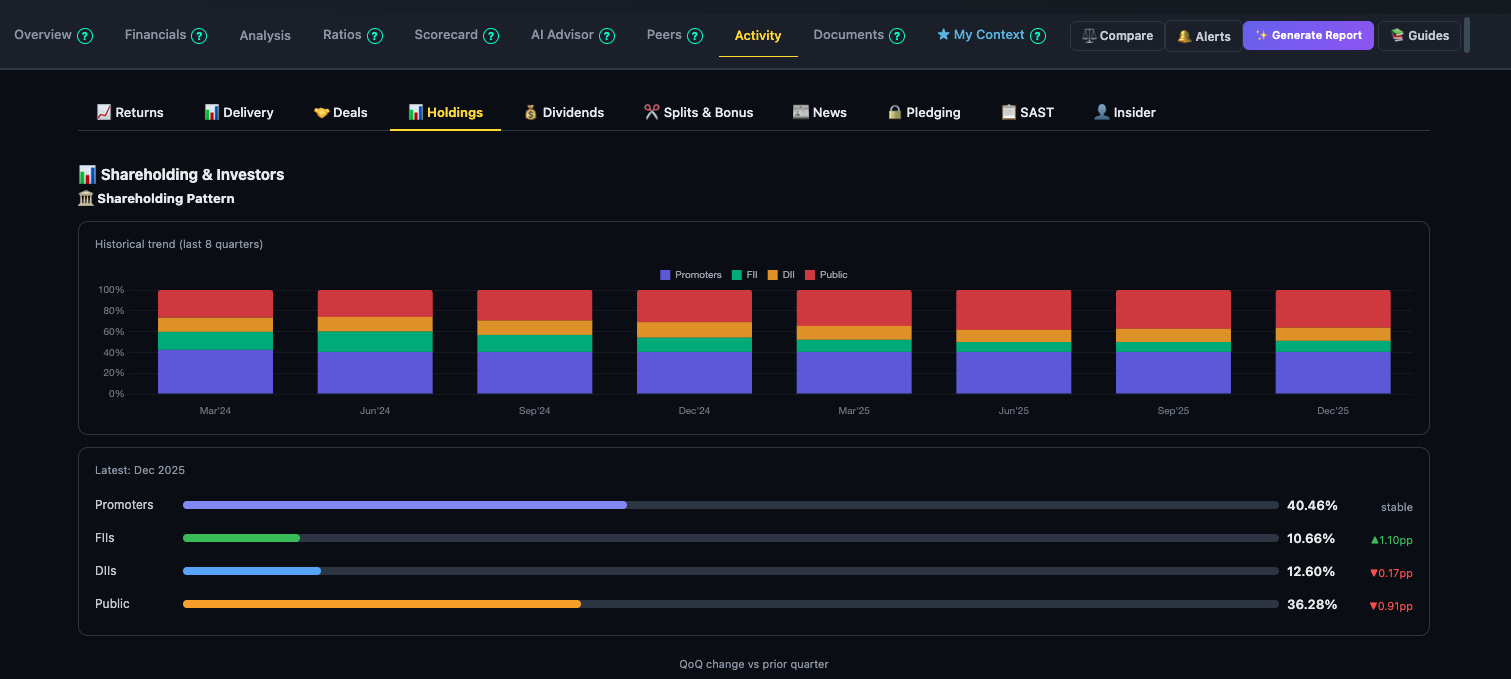
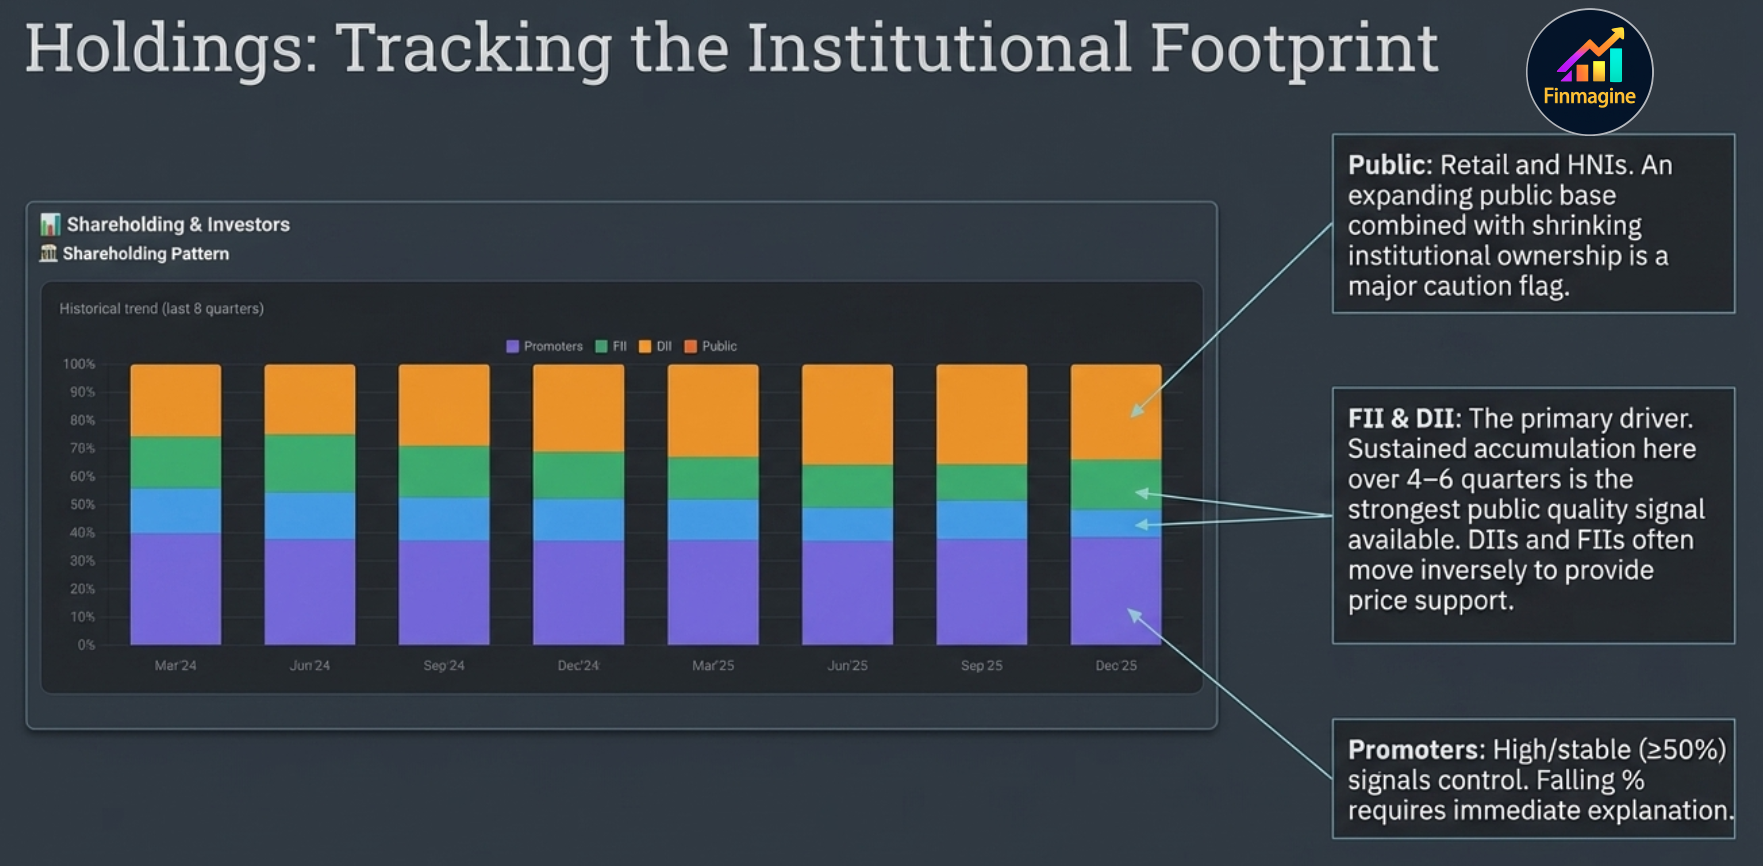
The shareholding pattern is disclosed quarterly by every listed company. It shows what percentage of the company is owned by four categories of shareholders. Finmagine plots this as a stacked bar chart so you can see trends across multiple quarters at a glance.
The Four Categories
- Promoter — founders, families, and the controlling group. High and stable promoter holding (≥50%) signals commitment. Falling promoter % needs explanation — is it a planned divestment, or forced selling due to pledged shares?
- FII (Foreign Institutional Investors) — global funds, sovereign wealth funds, QFIs. Rising FII % often precedes or accompanies a re-rating upward. Falling FII % can signal global risk-off or company-specific concerns.
- DII (Domestic Institutional Investors) — Indian mutual funds, insurance companies, banks. DII and FII often move in opposite directions — domestic funds buy when foreign funds sell, providing price support.
- Public — retail investors, HNIs, and small institutions. High public ownership combined with declining institutional ownership is a caution flag.
Big Bulls & Mutual Fund Holdings (Premium)
Below the shareholding pattern chart, Premium subscribers see two additional panels: Big Bulls (named HNIs and star investors who have disclosed ≥1% holdings) and Mutual Fund Holdings (individual schemes that have disclosed positions). These panels show the specific names, percentage held, and quarter-over-quarter change.
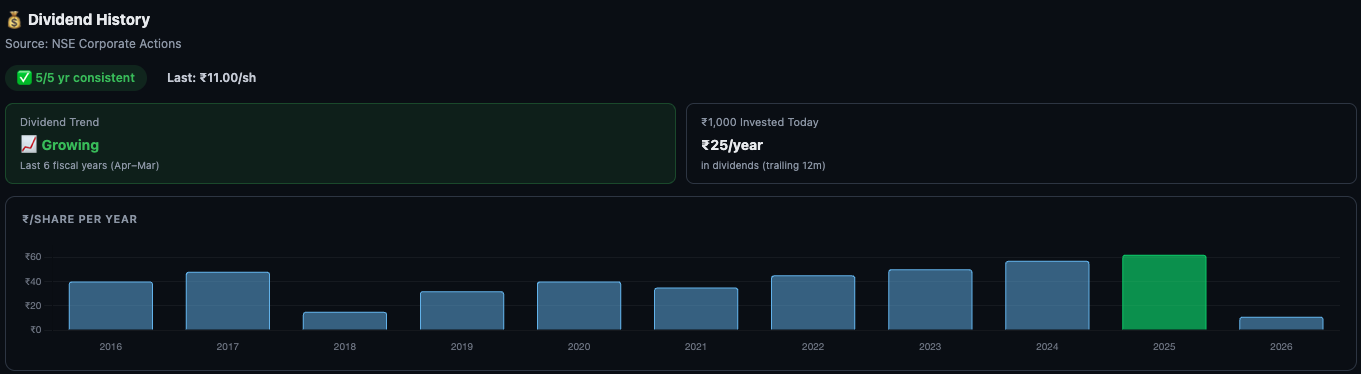
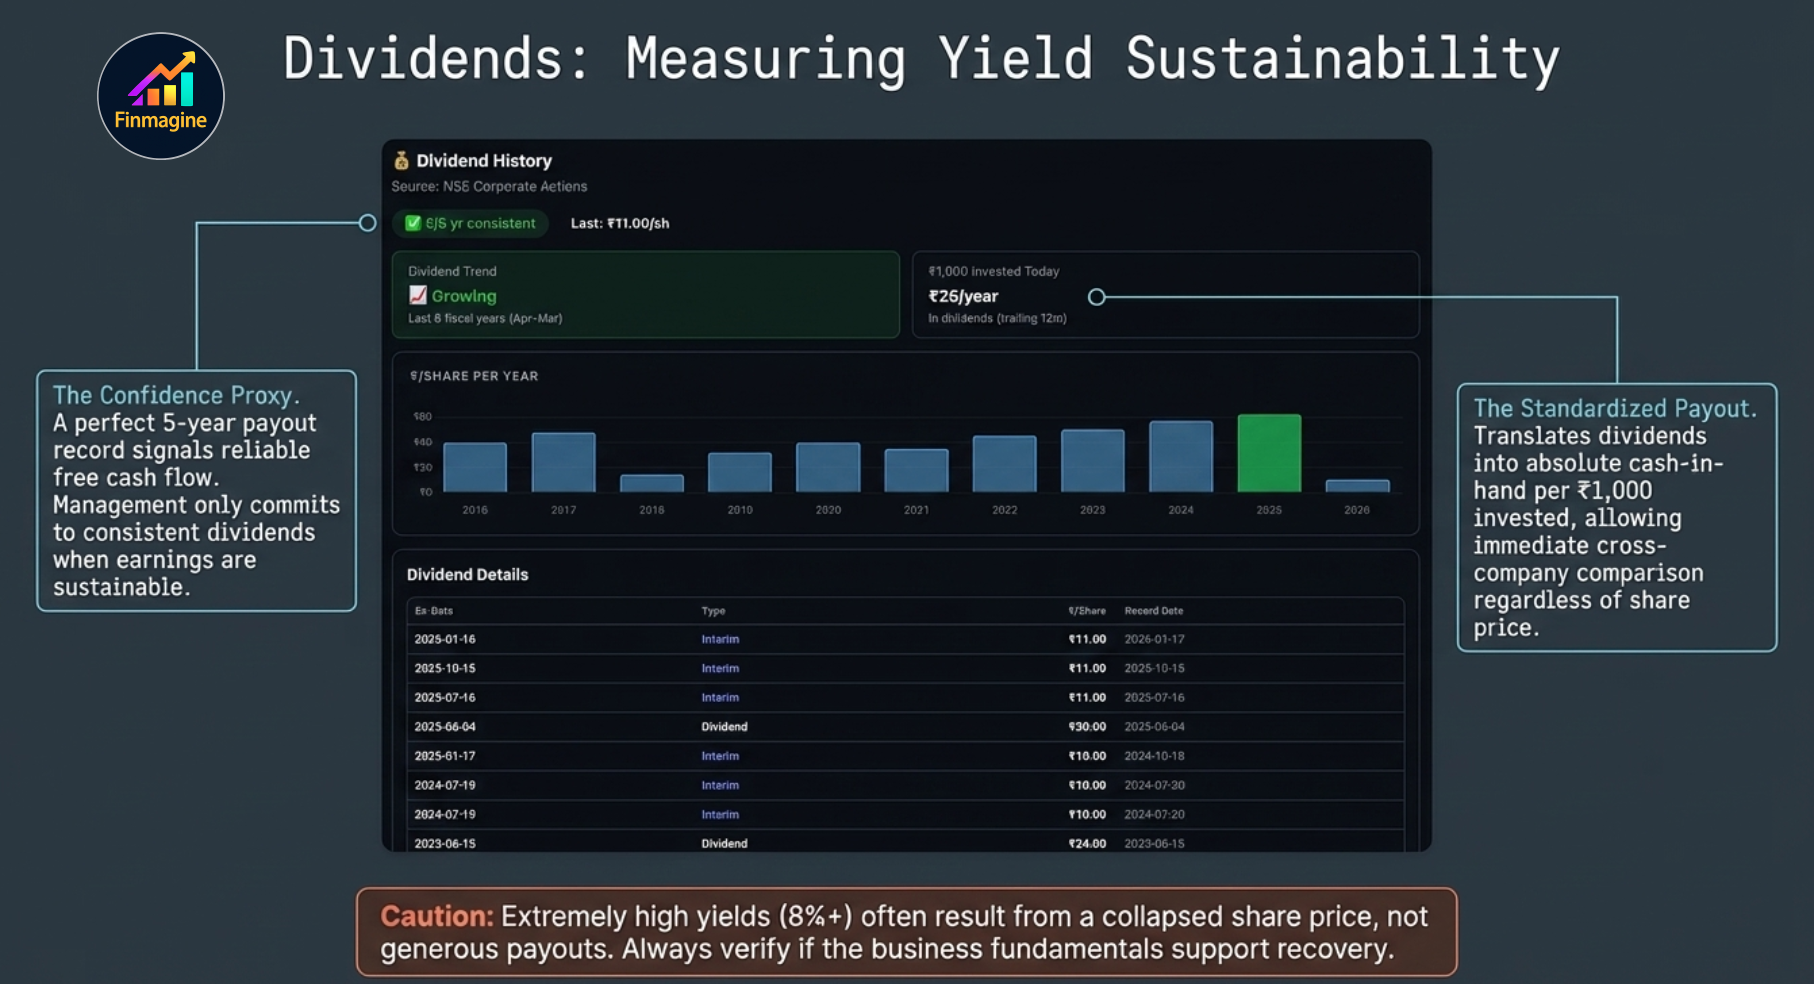
6. Dividends — History, Consistency & Yield
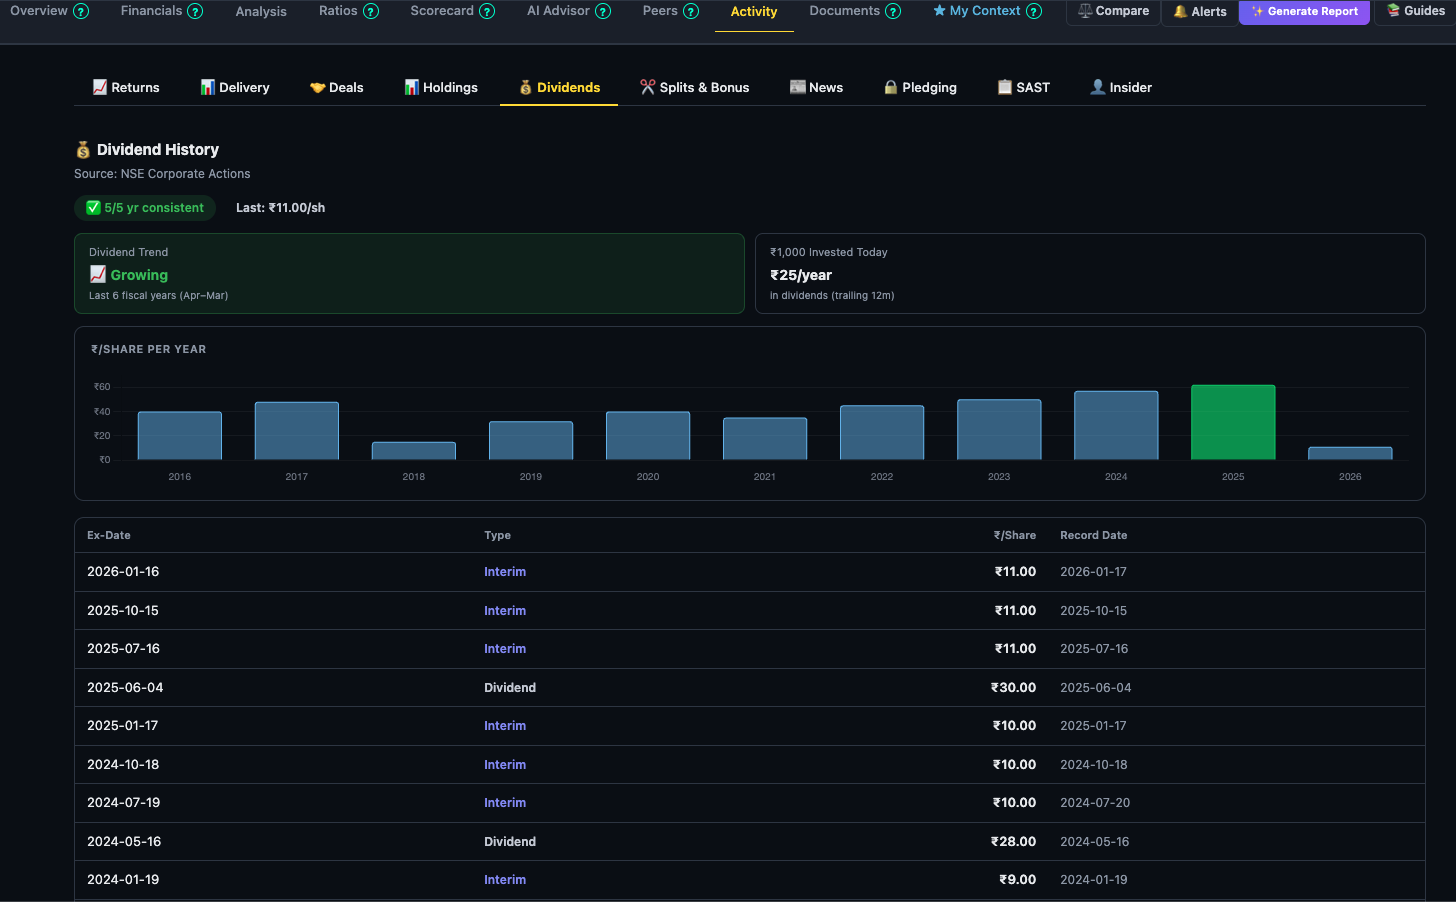
Reading the Dividend History
The dividend history table lists every dividend paid, with ex-date, face value, dividend per share, and record date. But the real value is in the summary metrics Finmagine calculates above the table:
The consistency badge tells you immediately how many of the last 5 years included a dividend payment. A 5/5 record means the company has never skipped a dividend in 5 years — strong signal of reliable free cash flow generation.
The Yield on ₹1000 invested metric is particularly practical — it translates the dividend into a cash-in-hand figure relative to a standardised investment, so you can compare dividend income across companies regardless of share price.
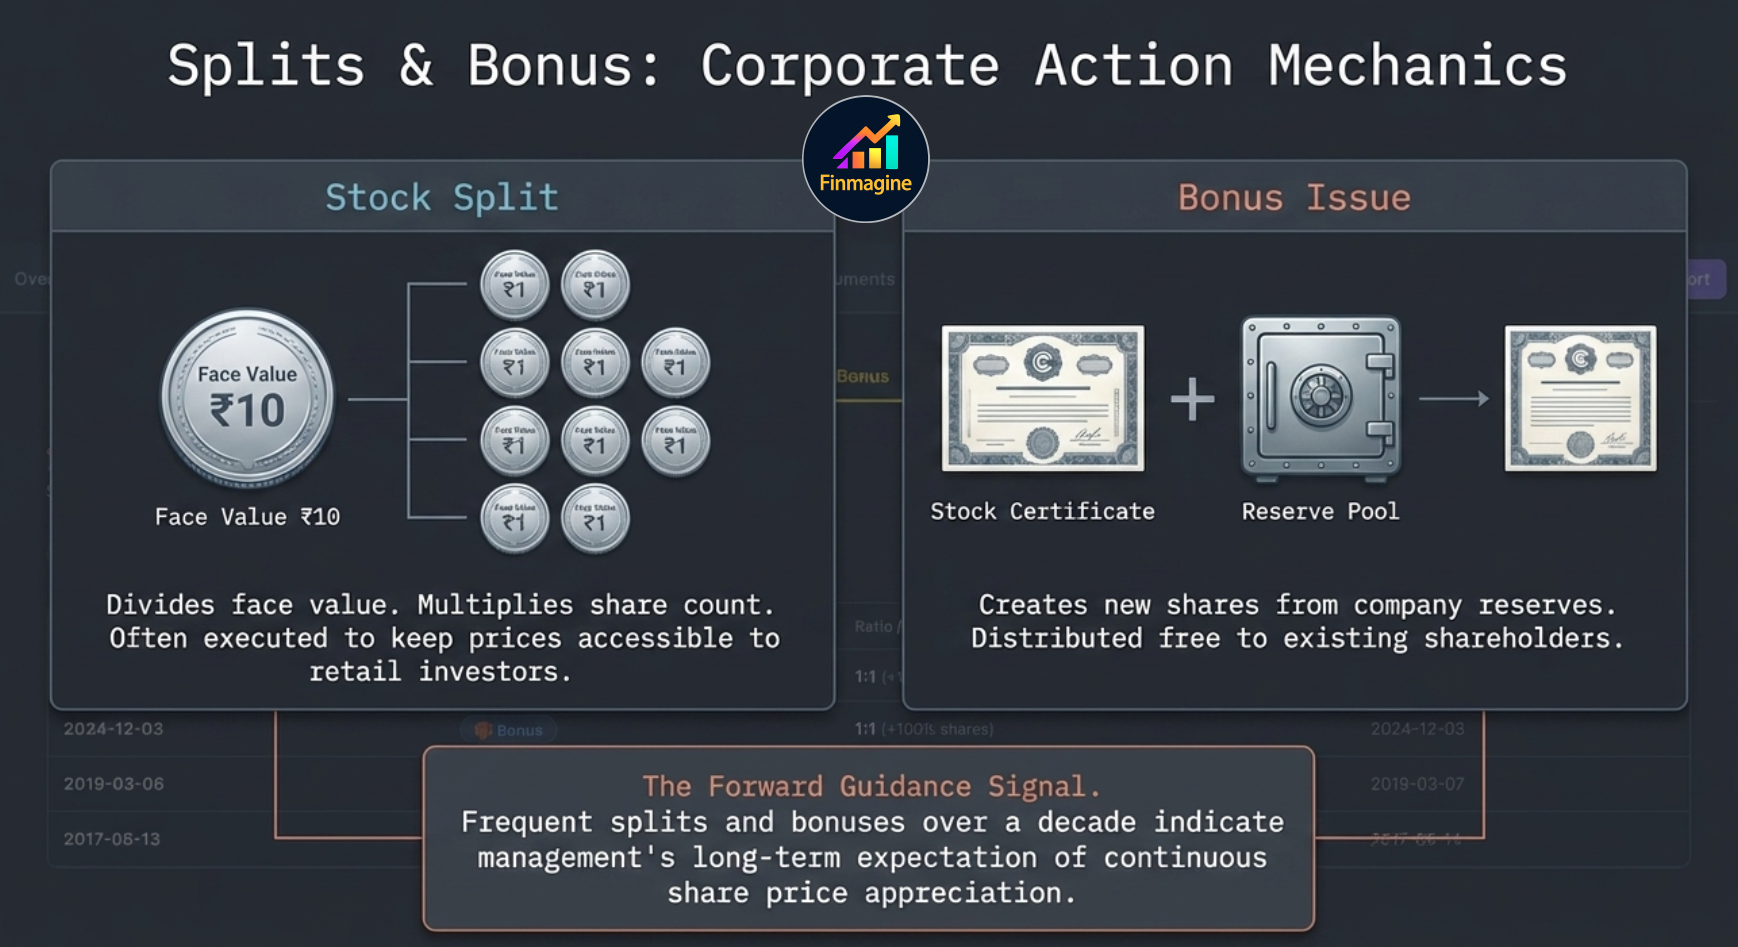
7. Splits & Bonus — Corporate Action History
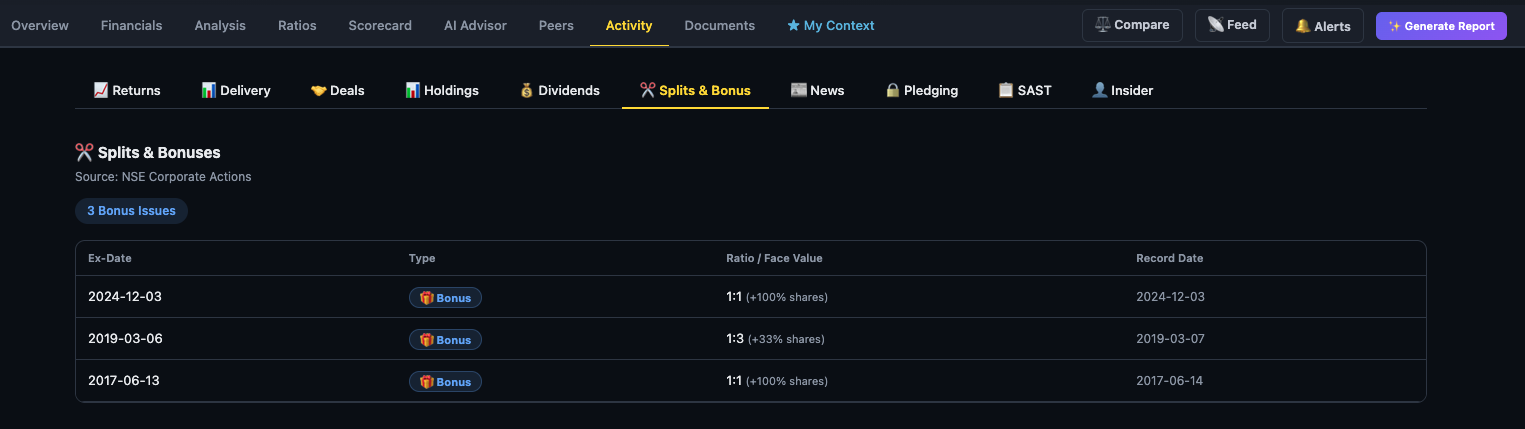
The Splits & Bonus sub-tab is a clean archive of all corporate actions that changed share count or face value. It covers:
- Stock Splits — face value is reduced (e.g. ₹10 → ₹1) and share count multiplies proportionally. A 10:1 split gives you 10 shares where you had 1, each worth 1/10th the price.
- Bonus Issues — new shares are issued to existing shareholders at no cost, funded from reserves. A 1:1 bonus doubles your holding; a 1:2 bonus adds one share for every two held.
- Face Value Changes — some older entries show pure face value reclassification without a split ratio.
Why This History Matters
A company that has split and issued bonuses multiple times over a decade is signalling long-term confidence in share price appreciation. Splits and bonuses happen when management expects the share price to reach levels that would make the stock illiquid without them — a form of positive forward guidance baked into action.
8. News — NSE Announcement Feed
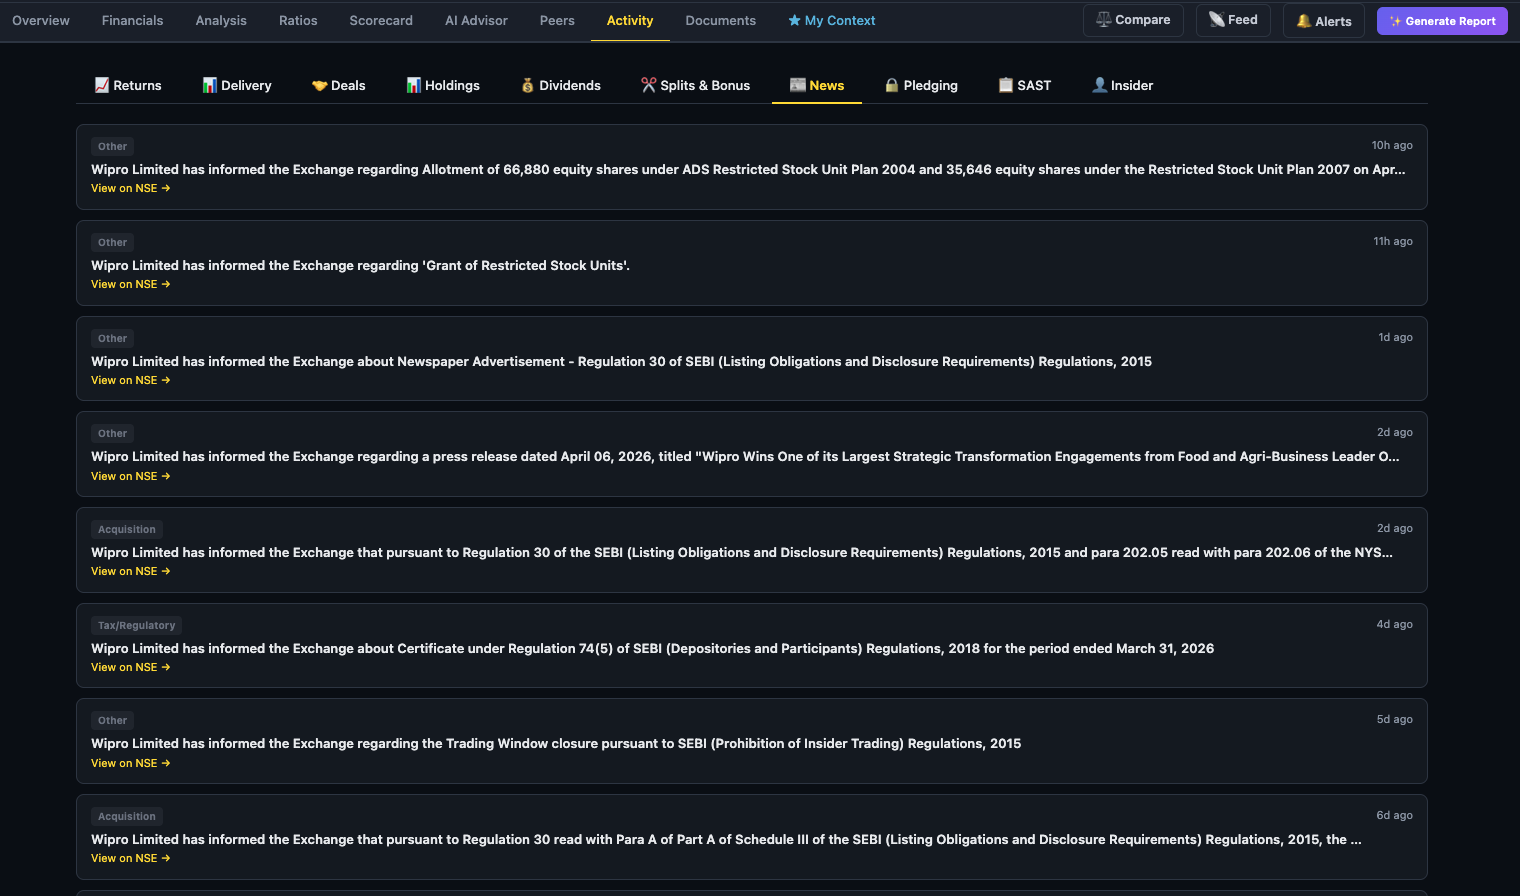
The News sub-tab is a filtered NSE exchange filing feed for the specific company you are viewing. This is different from generic market news — these are regulatory disclosures the company is legally required to file with the exchange.
Announcement Categories
- Acquisition — company is buying or merging with another entity. High-impact; requires careful reading to judge whether it is value-accretive or empire-building.
- Tax & Depository — SEBI/income tax notices, depository changes. Often routine but worth monitoring for patterns.
- Insider Trading — disclosures from connected persons about their trading activity. Covered in depth in the Governance guide.
- Board Meeting — dividend declarations, quarterly results announcements, major decisions. Always check these dates.
- Other — everything from NCLT orders to CSR disclosures to regulatory compliance filings.
9. The 7-Step Institutional Workflow
Each sub-tab answered a specific question. Strung together in order, they form a repeatable audit framework — the same workflow a professional analyst uses before deploying capital.
Step 1 Establish Price Context — Returns Tab
Ignore the daily percentage. Check the 3Y bar first — that is your structural anchor. Then check relative performance vs Nifty 50. If the stock has positive absolute returns but is underperforming the index, you are destroying relative value silently. Finally run the SIP Simulation: a negative 5-year SIP CAGR means the stock was overvalued at the start of the period and multiple compression has destroyed even disciplined investing.
Step 2 Verify Conviction — Delivery Tab
A green day with massive volume means nothing without delivery data. Strip out the intraday traders and algorithmic noise. When delivery % spikes above 60–70% on above-average volume on an up day, you have confirmation of real institutional accumulation. Without this check, you risk providing exit liquidity for speculators cashing out momentum trades.
Step 3 Follow the Smart Money — Deals Tab
Bulk and block deals are the documented footprints of market whales. A named mutual fund executing a pre-market block buy at the previous close price means their analysts have validated the valuation at that exact level. This is not a rumour or a chart pattern — it is a legal disclosure. Cross-reference: is the seller a promoter or a fund that is rotating out?
Step 4 Read the Macro Battleground — Holdings Tab
Individual deals are data points. The shareholding pattern chart over 4–6 quarters is the trend. The ideal setup: FII + DII bars growing quarter on quarter while the Public bar shrinks. This means retail investors are handing their equity to professional funds. That systematic institutional accumulation, validated by block deals, is the most powerful quality signal in publicly available data.
Step 5 Verify Boardroom Confidence — Dividends Tab
A flawless 5-year consistent dividend record is empirical proof that the company generates reliable, uninterrupted free cash flow regardless of economic cycles. Companies do not commit to dividends when cash flows are uncertain. Watch the trend direction more than the yield percentage — growing dividends signal that management is confident in the sustainability of earnings.
Step 6 Read Management's Forward Guidance — Splits & Bonus Tab
Management only splits stock or issues bonuses when they are highly confident the share price will continue appreciating — otherwise there is no point creating more shares. A company that has split and issued bonuses multiple times over a decade is signalling sustained confidence in long-term price appreciation. This is positive forward guidance baked into action, not words.
Step 7 Identify the Catalyst — News Tab
The News tab ties everything together. Every anomaly you found in Steps 1–6 has a regulatory filing behind it. Prioritise: Acquisition (value-accretive or empire-building?), Board Meeting outcomes, and any SEBI-related filings. But the most underrated signal is filing velocity: a company that normally files 2–3 documents a month suddenly filing 15 in a week is in operational distress or major restructuring — even before you open a single PDF.
Workflow Summary — Save or Print
10. The Governance Sub-Tabs — Covered Separately
Three sub-tabs in the Activity section — Pledging, SAST, and Insider — are deliberately covered in a separate guide. They answer a fundamentally different question from the seven data sub-tabs above:
- Data sub-tabs answer: what is happening with this stock in the market?
- Governance sub-tabs answer: what are the insiders and controllers doing with their own shares?
Promoter pledging, SAST disclosures (bulk acquisition / creeping acquisition), and insider trading patterns require their own analytical framework. A high pledge % can be either a red flag (distressed promoter) or unremarkable (routine financing) depending on context.
Read the Governance Signals Guide →Ready to Analyse Indian Stocks Like a Pro?
Finmagine gives you 30+ computed financial ratios, sector benchmarks, FII/DII flows, the Finmagine Score, and AI-powered analysis — all in one place.