Following along? Install Finmagine Trader first
Free NSE momentum scanner — no account needed • Chrome, Edge, Brave
Multimedia Learning Hub
Master the intersection logic behind Finmagine Trader's highest-conviction tab through analysis, market psychology, video walkthrough, audio deep dive, and 50 interactive flashcards
The All Three Signal: One Tab. Three Independent Confirmations. The Day's Highest-Conviction List.
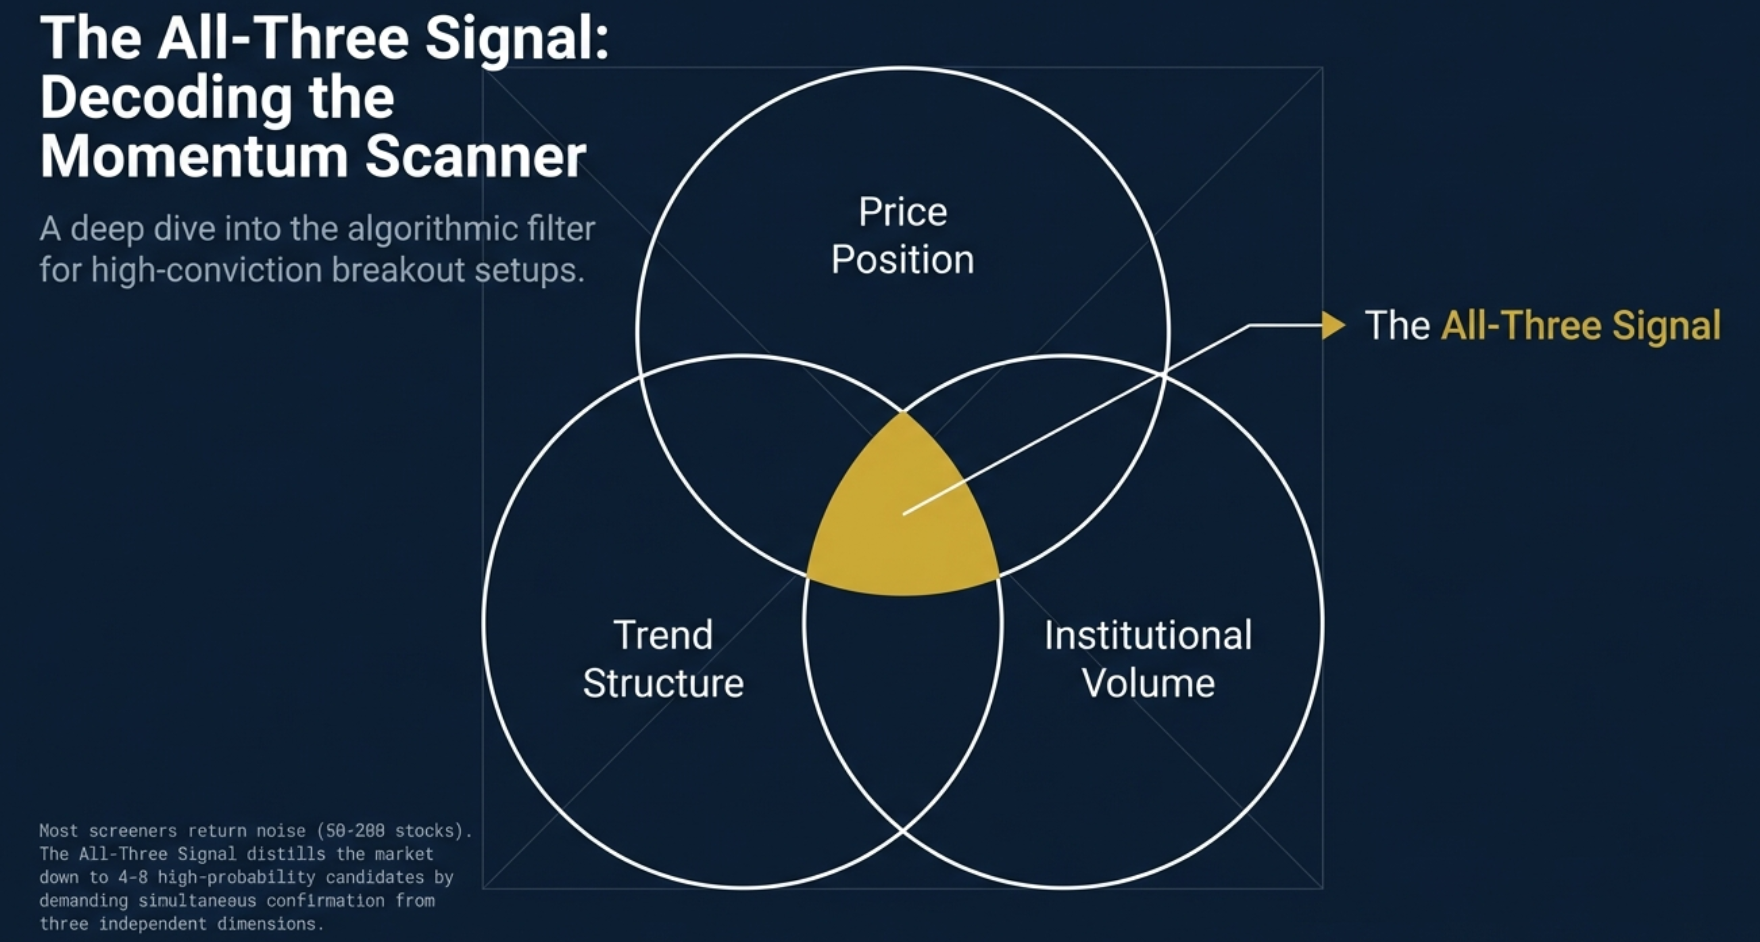
Most screeners hand you a list of 50 to 200 stocks. The All Three tab hands you 4 to 8. The difference is not a tighter filter — it is an intersection of three independently constructed signals that each measure a different dimension of a stock's momentum quality. When all three agree on the same stock simultaneously, the analytical noise that plagues single-signal screeners collapses.
- Stage 2 — Long-term institutional TREND
- Near 52W High — PRICE POSITION (no overhead supply)
- High Volume — TODAY's institutional ACTIVITY
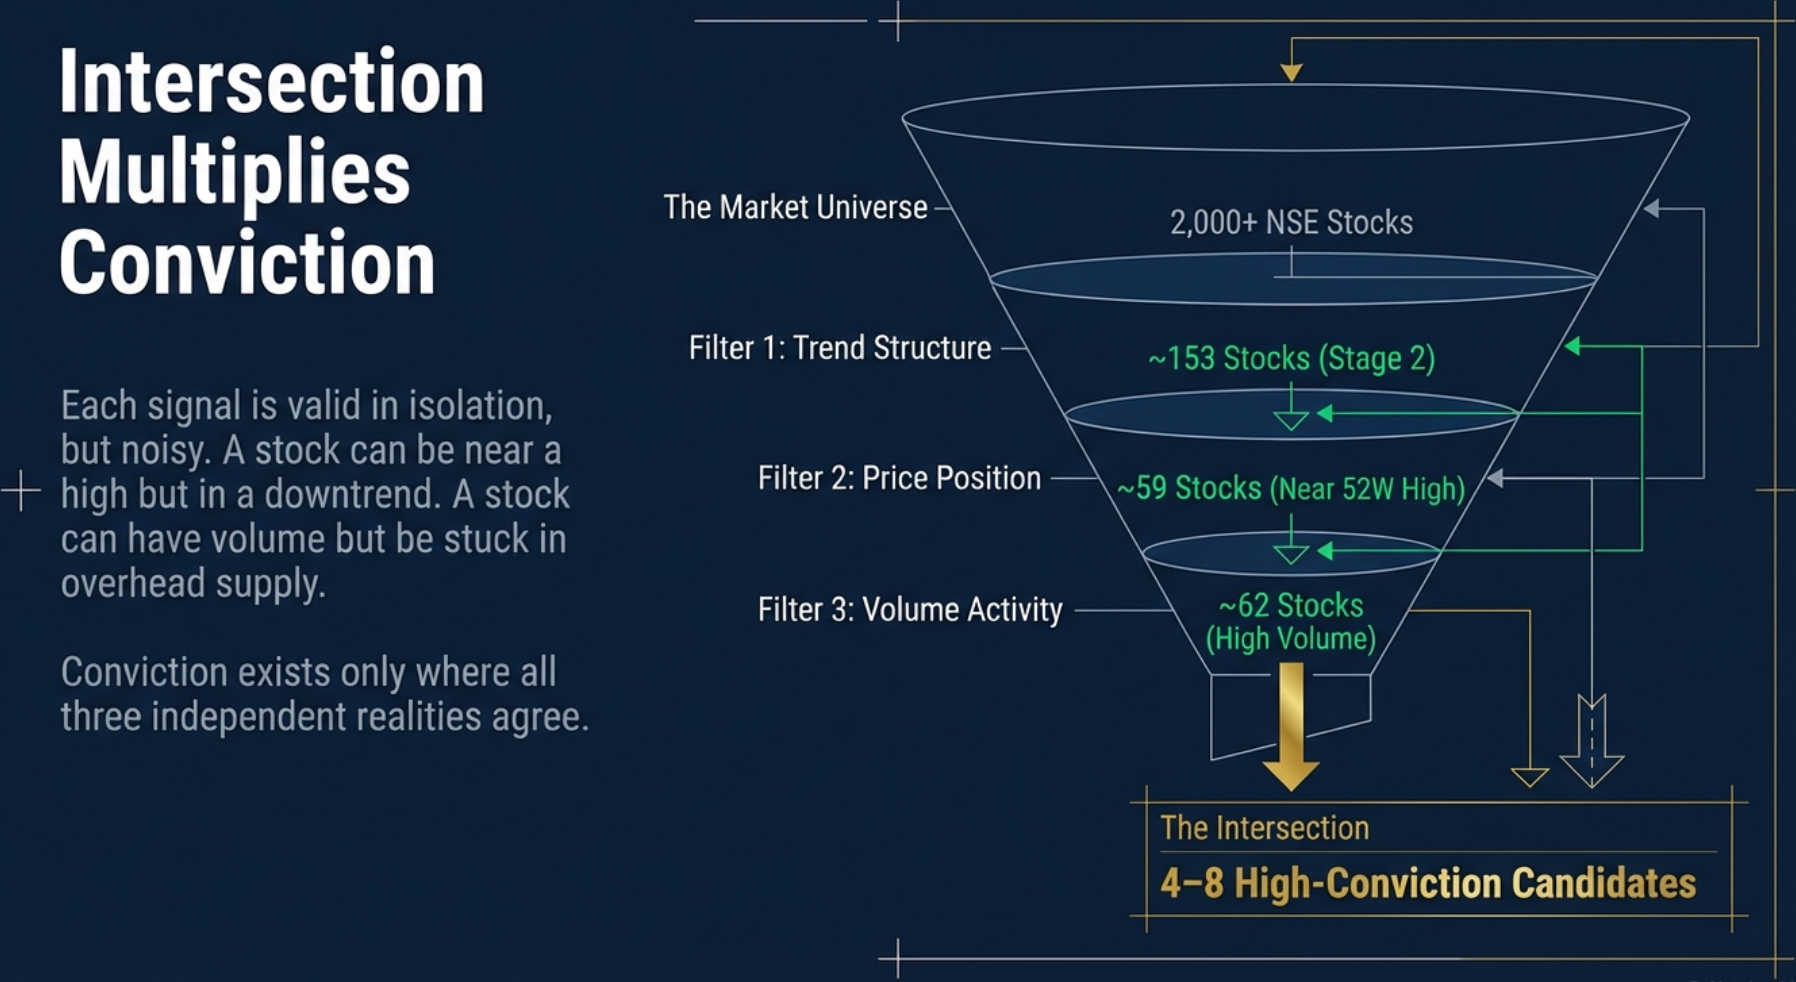
- Stage 2 alone: ~153 stocks
- Near 52W High alone: ~59 stocks
- High Volume alone: ~62 stocks
- All Three intersection: ~6 stocks
- 8+ stocks: Strong bull phase, full sizing
- 4–7 stocks: Normal momentum day
- 1–3 stocks: Breadth narrowing, reduce size
- 0 stocks: Stay in cash — the most important signal
Buy High, Sell Higher: The Momentum Strategy Most Investors Ignore — All-Three Signal Explained
This video walks through the complete philosophy and mechanics behind the All Three signal. It covers the buy-high philosophy that contradicts our evolutionary instincts, how overhead resistance creates invisible "brick walls" in falling stocks, why blue-sky territory above all-time highs is the path of least resistance, the Stage 2 lifecycle that defines an institutional advancing phase, and the precise mechanics of how all three screener rules combine to deliver a handful of high-conviction momentum candidates each morning. The 200 EMA exit rule — the discipline that controls loss size and lets winners run — is also explained in full.
In this video you will learn:
- Why buying at all-time highs is mathematically superior to buying on dips — and the evolutionary psychology reason most investors do the opposite
- What "overhead resistance" is and how trapped sellers create invisible brick walls at every prior price level above the current price
- Why "blue sky territory" above an all-time high has zero historical resistance — and why that makes it the path of least resistance for price
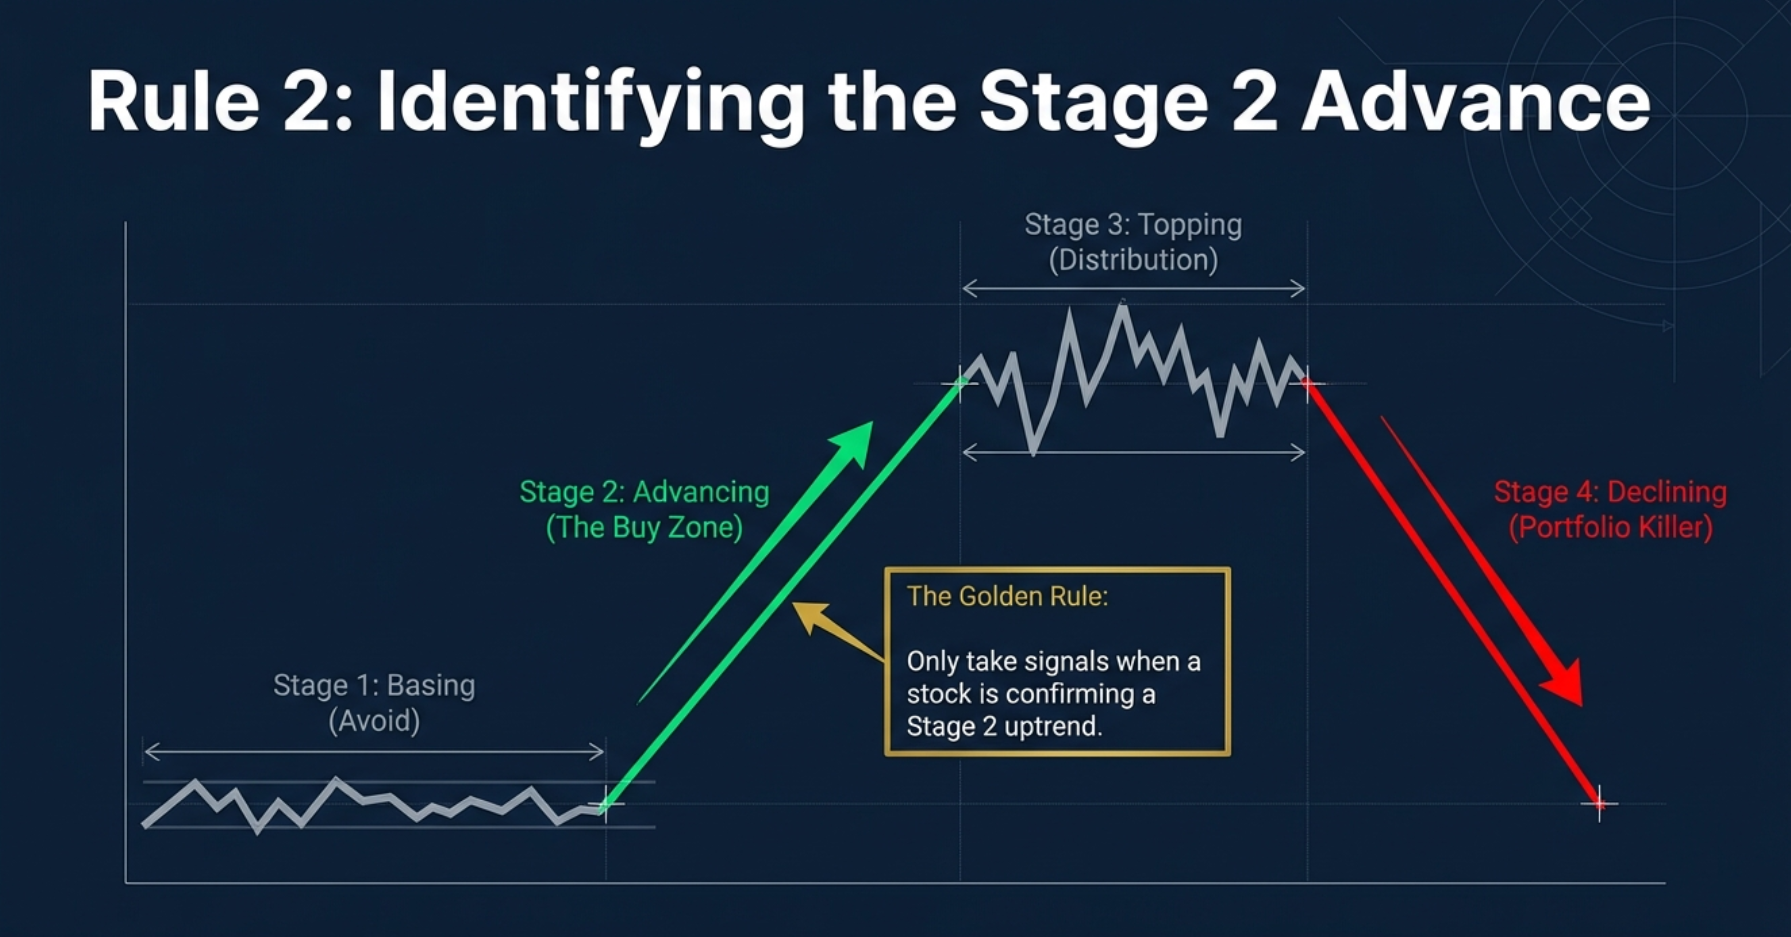
- The Stage 2 stock lifecycle: how stocks transition from base-building to institutional advancing phase to distribution and decline
- The exact mechanics of the three screener rules and what each one is actually checking in the data
- How the intersection of three independent signals collapses a 2,000-stock universe to a daily shortlist of 4–8 names
- The 200 EMA exit rule: why it is non-negotiable, how it caps downside, and why it keeps you in winning positions for months or years
- The IPO breakout variant: how to use the listing-day high as an entry trigger for newly listed stocks with zero overhead resistance
Audio Deep Dive: Buy High, Sell Higher — The Momentum Playbook
This audio session covers the complete All Three signal methodology from first principles. It begins with the buy-high philosophy and the market psychology that makes most investors instinctively do the opposite, moves through overhead resistance and blue-sky territory, explains how the Stage 2, Near 52-Week High, and High Volume screener rules each measure a genuinely independent dimension of momentum quality, and then walks through the practical trading framework: the three-step breakout entry pattern, position sizing, the 200 EMA exit rule, and why holding 7–10 concurrent positions is core to the strategy's risk management architecture.
Audio: Buy High, Sell Higher — The Momentum Playbook
Best for commute or post-market review. ~30 minutes.
The audio covers: the bargain hunter's trap and why evolution works against stock market investors, overhead resistance explained with real price-level examples, what "bhav bhagwan che" (price is god) means in practice, the four price-volume cycles, how institutions accumulate before breakouts, the delivery quantity vs delivery percentage distinction, the three-step entry pattern (dip, rocket recovery, ATH breakout), position sizing using the 200 EMA as a stop, and why holding multiple concurrent momentum positions creates asymmetric portfolio outcomes.
Test Your Knowledge — The All Three Signal — 50 Flashcards
Click any card to reveal the answer. Search by topic to focus on a specific area. All 50 flashcards cover every key concept in this article — from intersection logic and the three signal dimensions to the buy-high philosophy, scanner rules, volume truth detector, entry and exit rules, the Score column, morning workflow, and market health interpretation.
The Problem With Single-Signal Screeners
Every Indian market momentum trader eventually discovers screeners. Stage 2 returns 153 stocks on a typical trading day. Near 52-week High returns 59. High Volume returns 62. Each of these outputs is individually valid — each signal captures something real about the stock's behaviour. But individually, none of them tells you which five stocks you should actually be researching before the opening bell.
A stock near its 52-week high could be in a confirmed institutional uptrend — or it could be a beaten-down mid-cap that has bounced 15% off a one-year low in a single session, with overhead supply from trapped sellers at every prior price level above. A volume spike could indicate institutional accumulation — or it could be retail panic following a news event in a stock that has been in a Stage 4 decline for six months. Each individual signal is valid in isolation; but individually they do not confirm each other.
The result is the noise-to-signal problem. Given 153 Stage 2 stocks, which five do you actually research today? You cannot chart all 153. You cannot read the fundamentals on all 153. If you open the Stage 2 tab on Monday and try to work through the list, you will be working through it on Thursday. The single-signal screener gives you a valid universe, not a workable shortlist.
Each additional independent signal that agrees with the first does not merely filter the list — it multiplies conviction. A stock passing Stage 2 and Near 52W High simultaneously is not just "a Stage 2 stock that also happens to be near its high." It is a stock where two independently constructed analytical frameworks agree. Add a third independent signal and the agreement becomes rare enough to be meaningful: typically 4–8 stocks out of a 2,000+ stock universe. The rarity itself is the signal.
False positives compound this problem. A stock near its 52-week high in a Stage 4 downtrend is a false positive for the Near High screener. A volume spike in a declining stock is a false positive for the High Volume screener. Running any single screener in isolation generates false positives at a rate that makes the output difficult to use without substantial additional filtering. The intersection approach eliminates most of these false positives automatically — not through more filters, but through requiring independent confirmation.
The All Three tab is the answer to the noise-to-signal problem. It does not add more criteria to a single screener. It requires that three entirely separate screeners — each built around a different analytical dimension — all agree on the same stock simultaneously. The result is a list small enough to research completely in a single morning session.
The Three Signals — What Each One Confirms
Understanding what each signal actually measures — and crucially, what it cannot measure alone — is the foundation of understanding why the intersection carries so much more conviction than any individual signal. Each screener is built around a distinct analytical question about the stock's behaviour.
| Signal | What It Confirms | Typical Count | What It Cannot Confirm Alone |
|---|---|---|---|
| Stage 2 | Institutional long-term uptrend in place (SMA 50 > 150 > 200, all rising) | ~153 stocks | Whether supply exists above price today or if institutions are active THIS session |
| Near 52W High | No overhead supply, price in discovery territory (within 2% of annual high) | ~59 stocks | Whether the uptrend structure is intact or whether institutional activity is happening now |
| High Volume | Active institutional buying confirmed TODAY (volume > 20-day avg, price up >1%, non-F&O cash market) | ~62 stocks | Whether the long-term trend is in place or whether the stock has supply above it |
Stage 2 is a long-duration signal. It tells you that the stock has been systematically accumulated by institutions over weeks or months — the 50-day SMA is above the 150-day SMA, which is above the 200-day SMA, and all three are rising. This is the Stan Weinstein definition of an institutional advancement phase. But Stage 2 alone says nothing about whether there is overhead resistance from sellers who bought at higher prices, or whether institutions are actually active in the stock on this specific trading session.
Near 52-week High is a supply signal. When a stock closes within 2% of its one-year high, it means that every investor who has held the stock for the past year is currently in profit. There are no trapped sellers at any price between the current price and the 52-week high — no one is sitting on a loss waiting to break even and sell. Price is in discovery territory. But Near 52W High alone says nothing about whether the trend structure is intact or whether buying volume confirms that institutions are active.
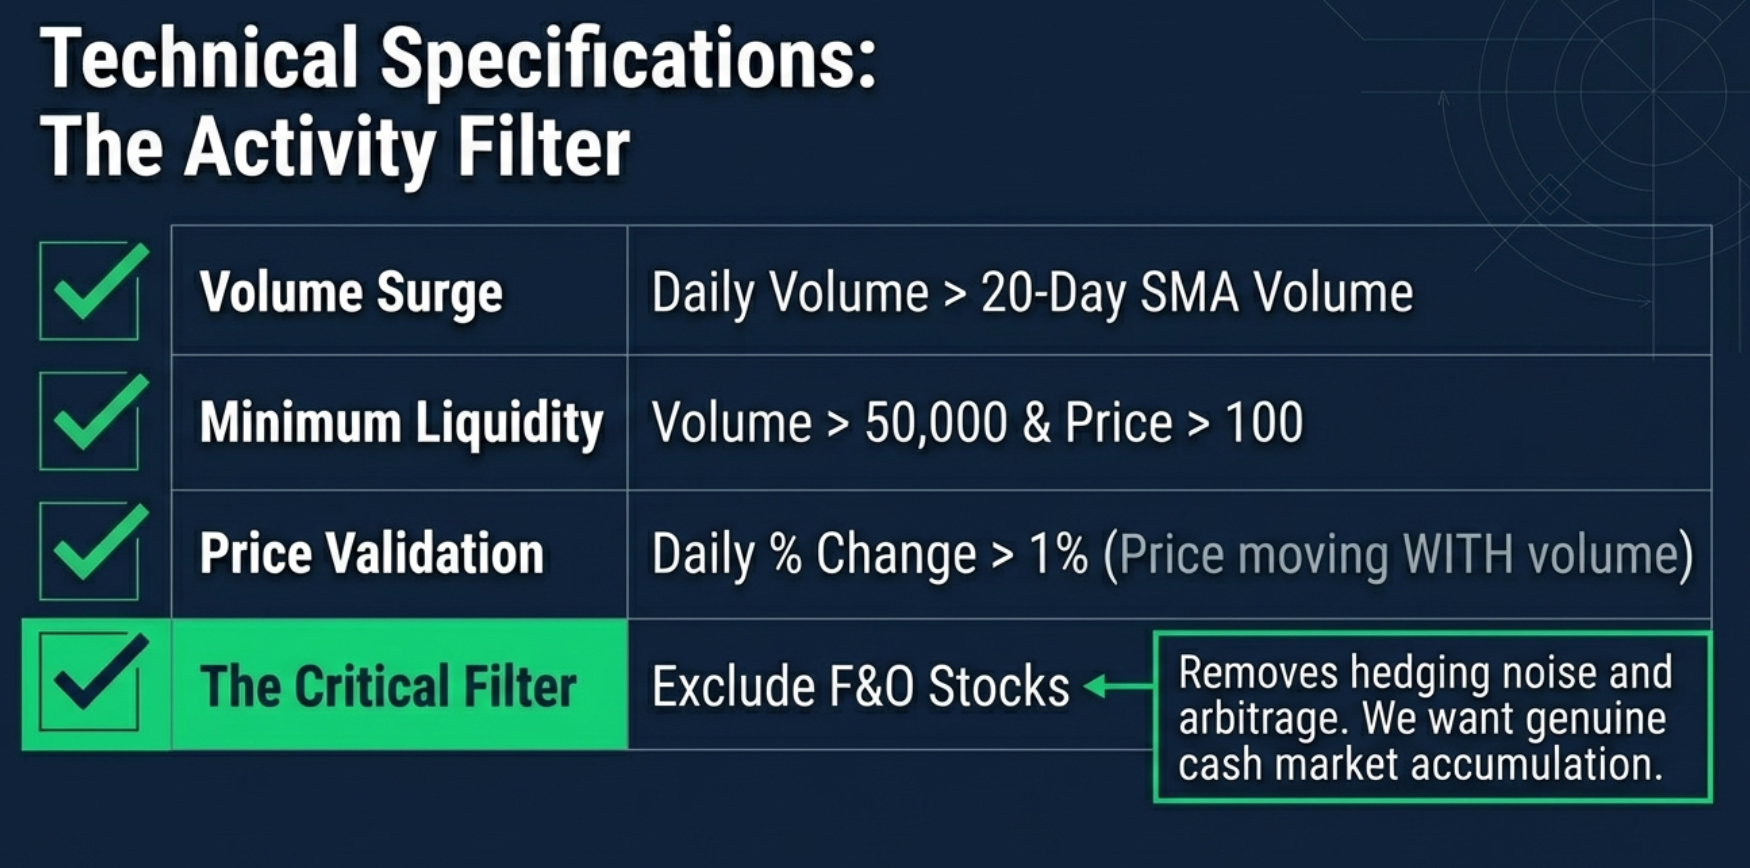
High Volume is a same-day activity signal. When volume surges above the 20-day average alongside a price rise of more than 1% — specifically in non-F&O cash market stocks — it confirms that large buyers are active today. The F&O exclusion is deliberate: derivative-driven stocks can show volume surges that reflect options hedging or futures rollovers rather than clean accumulation in the underlying stock. High Volume alone says nothing about whether the trend is intact or whether the stock has already passed its overhead supply.
The power of the intersection is precisely that each signal fills the blind spots of the other two. Stage 2 tells you the trend is real. Near High tells you there is no supply above. High Volume tells you buying is active today. Together, they answer three questions that no single signal can answer alone.
The Three Scanner Rules: Decoded in Plain English
Each of the three screeners in the All Three signal runs a specific set of conditions against real-time market data. Understanding exactly what the screener is checking — in plain language — turns the output from a black box into a transparent analytical tool you can reason about. Here is every condition, explained without unnecessary jargon.
Rule 1 — Near 52-Week High (3 Conditions)
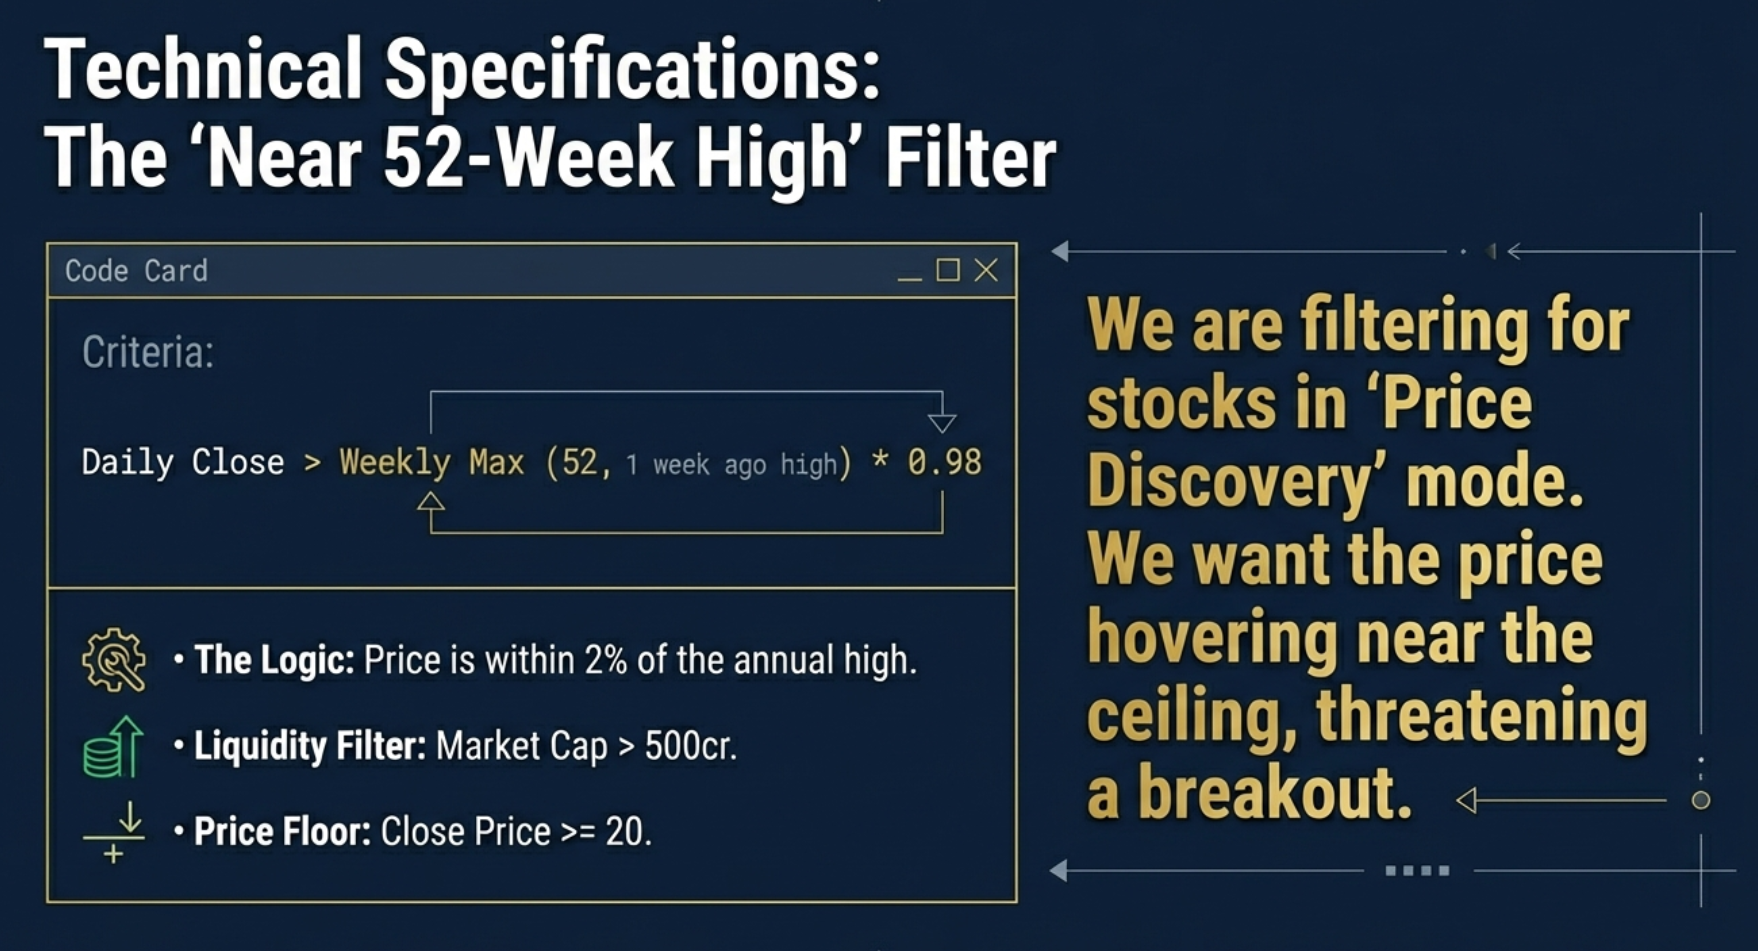
This rule answers the question: "Is this stock trading in new-high territory with no meaningful overhead resistance?" It checks three things.
| Condition | What the Screener Checks | Why It Matters |
|---|---|---|
| Price within 2% of 52-week high | Today's closing price must be above 98% of the highest weekly high the stock achieved in the entire past year. Example: if the 52-week high was ₹500, the stock must be trading above ₹490 right now. | Any stock below this threshold has overhead resistance — shareholders who bought above the current price and are waiting to break even. At 98%+, virtually every prior-year holder is in profit. There are no trapped sellers. |
| Minimum price ₹20 | The stock's price must be at least ₹20 per share. | Stocks priced below ₹20 are in sub-penny-stock territory for the Indian market. Their price movements can be manipulated with small amounts of capital. A ₹5 stock moving to ₹6 is a 20% gain driven by trivially small absolute flows. The filter keeps the output to legitimate, real-capital stocks. |
| Minimum market cap ₹500 Crore | The company's total market capitalisation must be at least ₹500 Crore (5 billion rupees). | Below ₹500 Crore, stocks are in genuine micro-cap territory where operator manipulation is common. Price movements often reflect concentrated position management by a single large holder, not genuine institutional buying. Above ₹500 Crore, it takes real capital flows to move prices — which is what the screener is designed to track. |
Rule 2 — Stage 2 Trend Template (10 Conditions)
This rule answers the question: "Is this stock in a confirmed, multi-month institutional advancing phase — the Stan Weinstein Stage 2?" It is the most comprehensive of the three rules, checking ten conditions across moving average alignment, price position relative to moving averages, momentum off the annual low, and minimum liquidity.
| Condition | Plain English | Why It Matters |
|---|---|---|
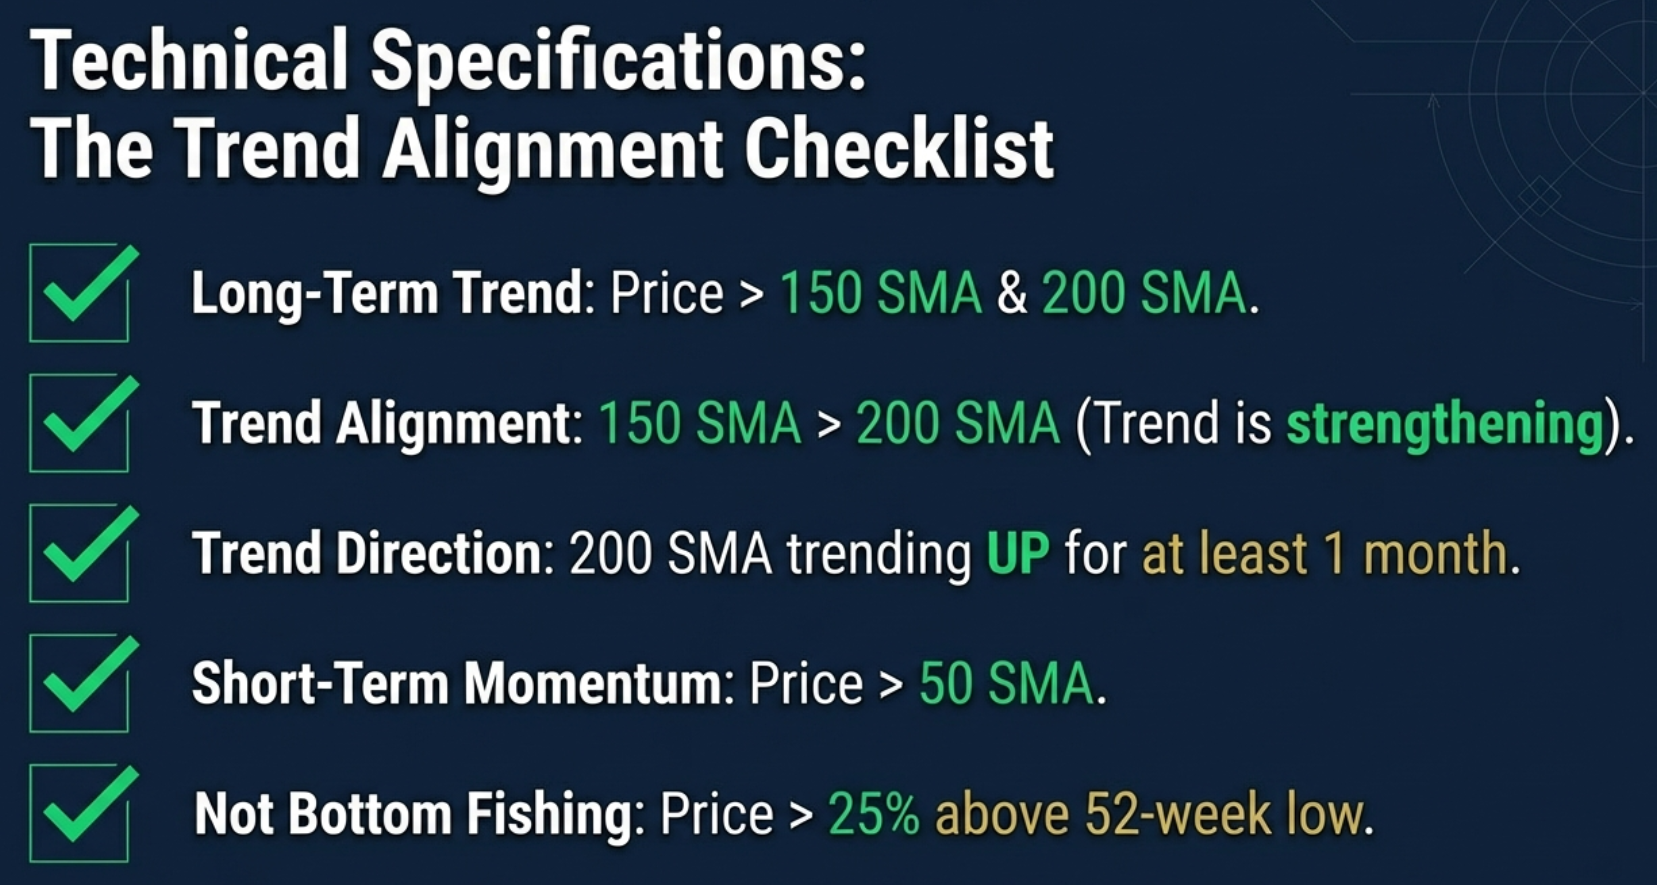
| Price above 150-day SMA | The current stock price must be above the average of the last 150 trading days' closing prices. | A stock below its 150-day SMA is, by definition, weaker than its own 7-month average. Being above it confirms medium-term trend strength. |
| Price above 200-day SMA | The current stock price must also be above the average of the last 200 trading days' closing prices. | The 200-day SMA is the global benchmark for long-term trend health. A stock below its 200-day SMA is structurally in a bear phase by any institutional definition. Being above it is a minimum threshold for "acceptable long-term trend." |
| 150-day SMA above 200-day SMA | The medium-term average (150 days) must be higher than the long-term average (200 days). The faster line is above the slower line. | This confirms the trend direction. When the 150-day is above the 200-day, recent prices have been running higher than older prices on average — the trend is up, not sideways or down. |
| 200-day SMA is rising | The 200-day SMA today must be higher than it was 20 days ago, OR higher than it was 80 days ago, OR higher than it was 100 days ago. Any one of these three comparisons must be true. | A flat 200-day SMA means the stock has gone roughly nowhere for a year — it is consolidating, not advancing. A rising 200-day SMA means the long-term floor itself is moving up. This is the single most important condition in Stage 2: it separates genuine advancing phases from long sideways ranges. |
| 50-day SMA above 150-day SMA | The short-term average (50 days) must be above the medium-term average (150 days). | Combined with the conditions above, this creates the full institutional SMA stack: Price > 50-day > 150-day > 200-day. Each moving average layer is above the next slower one. This is textbook institutional uptrend alignment. |
| Current low is at least 1.5x the 52-week low | Today's intraday low price must be at least 50% higher than the lowest price the stock reached in the past year. | This is NOT about buying at the bottom. It confirms the stock already has established momentum off its floor. A stock that has risen only 5% from its annual low has barely moved. One that has risen 50%+ has demonstrated real accumulation and buying pressure over months. |
| Current high is at least 75% of the 52-week high | Today's intraday high must be at least 75% of the stock's highest price in the past year. | The stock must be in the upper portion of its annual price range. Being in the bottom half of the year's range while claiming to be in a Stage 2 uptrend is contradictory. This condition ensures price is in the upper 25% of its yearly range. |
| Minimum price ₹10 | The stock's price must be at least ₹10. | Sub-₹10 stocks are excluded from Stage 2 analysis for the same reason as sub-₹20 stocks in the Near High rule — trivially small capital can move them, distorting the moving average signals. |
| Daily liquidity above ₹10 lakh | The stock's price multiplied by its 50-day average daily volume must exceed ₹10,00,000 (10 lakh rupees) of daily traded value. | Even a stock in a perfect Stage 2 uptrend is useless if you cannot build a meaningful position without moving the price yourself. ₹10 lakh daily liquidity is a basic floor ensuring the stock is tradeable at retail and small-institution sizes. |
| Stock has traded today | Volume on the current day must be greater than zero. | This excludes stocks that have been suspended, circuit-halted, or simply not traded on this day. A stock with no trades cannot have meaningful price signals. |
Rule 3 — High Volume (6 Conditions)
This rule answers the question: "Is institutional buying actively occurring in this stock TODAY — on this specific trading session?" It uses today's volume and price data, not historical moving averages. It is the most time-sensitive of the three rules.
| Condition | Plain English | Why It Matters |
|---|---|---|
| Today's volume > 20-day average volume | The number of shares traded today must exceed the daily average of the past 20 trading sessions (one calendar month). | This is the core of the rule. If more shares are changing hands than the recent daily average, something unusual is happening. Routine days have routine volume. Elevated volume means elevated interest — someone significant is buying. |
| Minimum 50,000 shares traded | At least 50,000 shares must have traded today, regardless of how that compares to the average. | A stock that normally trades 1,000 shares per day could pass the "above average" condition on a day it trades 2,000 shares. 50,000 is a floor ensuring enough absolute volume for a real, tradeable event. |
| Minimum price ₹100 | The stock must be priced above ₹100 per share. | Very cheap stocks (below ₹100) can show large percentage volume surges on tiny absolute rupee flows. A ₹5 stock trading 1,00,000 shares is only ₹5,00,000 of total turnover — insignificant for institutional-size trades. The ₹100 floor ensures the volume surge represents meaningful rupee flows. |
| Price up more than 1% today | The stock's closing price today must be at least 1% higher than yesterday's close. | Volume with falling price is selling (distribution). Volume with rising price is buying (accumulation). The 1% minimum price gain filters out days where high volume is driven by panic selling or forced selling, not genuine institutional buying intent. Volume must come with price strength. |
| Not an F&O stock (cash market only) | Stocks that are part of the Futures and Options segment are excluded. Only pure cash-market stocks are included. ETFs and mutual fund segments are also excluded. | Institutions that trade derivatives often hedge their positions by buying or selling the underlying cash stock. A large futures position may trigger cash-market buying that has zero directional intent — it is pure arithmetic hedging. Excluding F&O gives a cleaner signal: volume surges in non-derivative stocks are far more likely to represent genuine directional accumulation. |
| Price above 50-day SMA | The closing price must be above the 50-day simple moving average. | Volume breakouts above the 50-day SMA confirm that the buying is happening in a short-term uptrend, not a dead-cat bounce in a declining stock. This is a final confirmation that the surge is directionally consistent with trend, not against it. |

Rule 1 (Near 52W High) measures WHERE price IS right now — its position relative to a full year of history. Rule 2 (Stage 2) measures WHERE price HAS BEEN over months — the long-term trend structure built by institutional accumulation over time. Rule 3 (High Volume) measures what is happening THIS SESSION — today's real-time capital flows. Each rule uses a completely different data point: price-to-annual-high ratio, multi-month moving average alignment, and same-day volume. This is why their intersection is so powerful. They cannot all fire together unless something genuinely unusual is occurring across three independent analytical dimensions simultaneously.
Why Intersection Multiplies Conviction
The three signals in the All Three tab measure what statisticians call orthogonal dimensions — they are conceptually independent from each other. Trend (Stage 2) is a function of moving average alignment over months. Price position (Near High) is a function of current price relative to the one-year range. Current activity (High Volume) is a function of today's trading session volume versus recent averages. A stock can be in Stage 2 without being near its high. A stock can be near its high without being in Stage 2. A stock can have high volume without either. The three signals are not different ways of measuring the same thing.
This independence is what makes the intersection so powerful. When independent signals agree, the agreement is informative precisely because it was not guaranteed. If all three signals measured the same underlying phenomenon, seeing all three fire together would tell you nothing you did not already know from the first signal. Because they measure different things, three simultaneous agreements represent convergence from three separate analytical frameworks — a much stronger statement than any single framework alone.
| Filter Level | Conviction Level | Typical Count | False Signal Risk |
|---|---|---|---|
| Single Signal | Low — one dimension confirmed | 59–153 stocks | High — other dimensions unverified |
| Two Signals | Medium — two dimensions confirmed | ~36 stocks (Stage 2 + Near High) | Moderate — current session activity unverified |
| All Three | High — three independent dimensions confirmed | ~6 stocks | Low — trend, price position, and today's activity all agree |
Every stock in the All Three tab shares three properties simultaneously: a long-term institutional uptrend confirmed over months (Stage 2) + no trapped sellers above current price, price in discovery territory (Near 52W High) + fresh institutional buying active in today's session (High Volume). Three independent analytical angles. One extremely small list. This is the definition of highest-conviction in the context of momentum screening.
The mathematics of intersection reinforce this. Stage 2 passes roughly 153 of 2,000+ NSE stocks on a typical day — about 7.5%. Near 52W High passes roughly 59 — about 3%. High Volume passes roughly 62 — about 3%. If these signals were statistically independent and randomly distributed across the stock universe, the intersection would contain roughly 0.075 × 0.03 × 0.03 × 2000 = approximately 0.135 stocks. The fact that roughly 4–8 stocks pass all three reflects that the signals are positively correlated — stocks in strong trends tend to also be near their highs and sometimes attract institutional volume — but far from perfectly correlated. The intersection is rare, and its rarity is what makes it valuable.
None of this means every All Three stock will continue higher. No screener guarantees future price behaviour. What it means is that these stocks carry a simultaneous combination of characteristics that is statistically uncommon and analytically meaningful. They warrant chart examination. They deserve to be on the research list for the morning. Whether to trade them — and at what entry, with what position size, and with what exit plan — remains the trader's judgment call after chart analysis.
What the Daily All Three Count Tells You About the Market
The All Three tab is not just a stock picker. The number of stocks it returns each day is itself one of the most useful real-time market health indicators available to a momentum trader. The count tells you whether the market is in a phase where momentum strategies have edge — or whether the conditions that create high-conviction setups are absent.
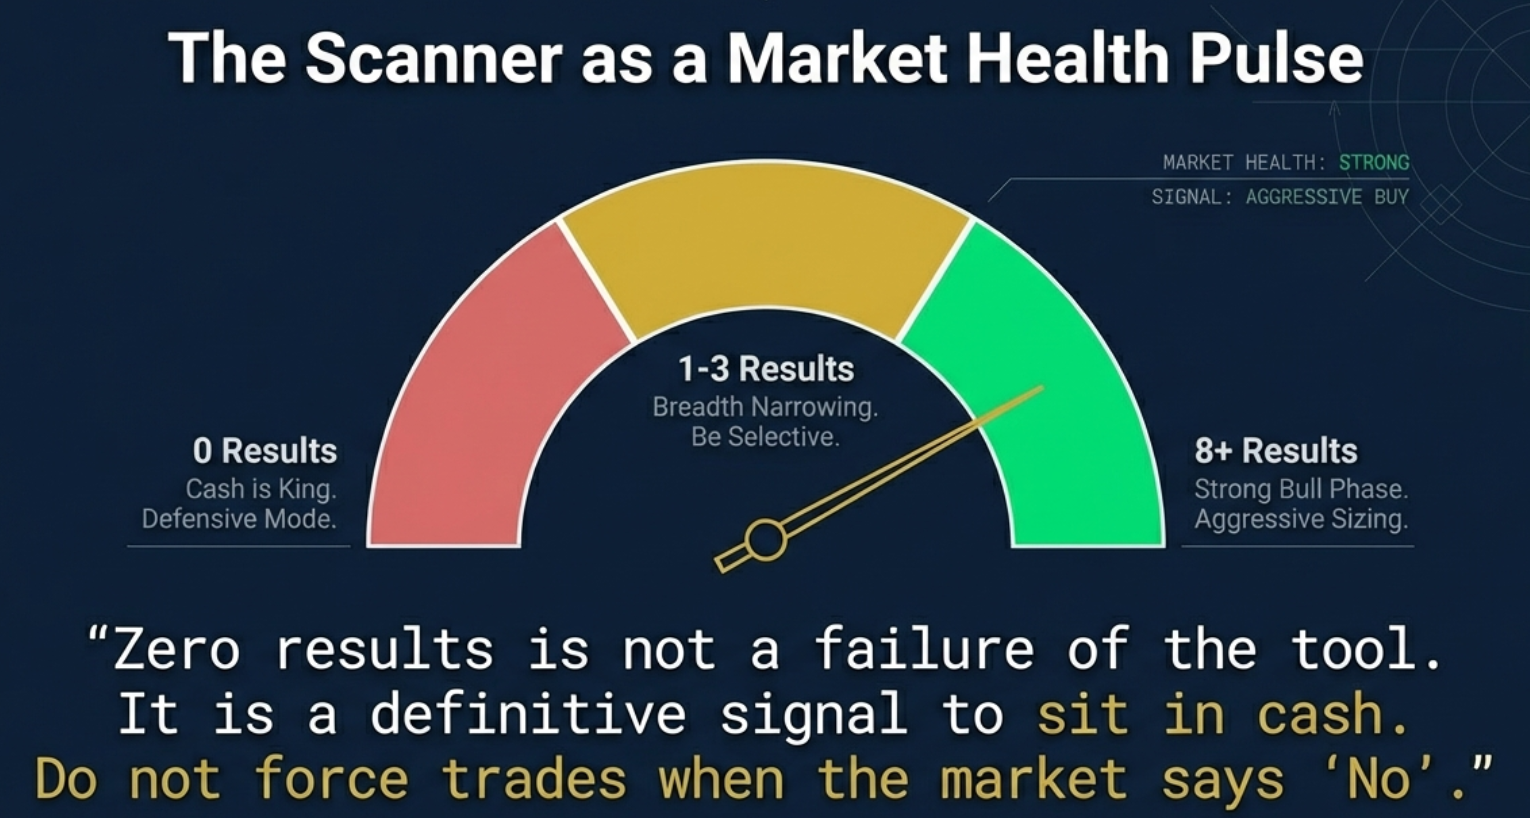
8+ Stocks
Market breadth is healthy. Momentum strategies have maximum edge. Multiple sectors participating simultaneously. Full position sizing is appropriate for well-structured setups.
4–7 Stocks
Selective opportunities present. Standard position sizing appropriate. These are the days when careful chart selection matters most — not every name on the list will have a clean setup.
1–3 Stocks
Market breadth is contracting. Even if indices are printing new highs, fewer stocks are participating. Reduce position sizing. Market fatigue is present beneath the headline numbers.
0 Stocks
The market is NOT in a momentum phase. Stay in cash. Reduce exposure. Zero results is not a failure of the tool — it IS the tool working correctly and telling you something critical.
"When All Three has zero results, the market is telling you something more valuable than any buy signal could. It is telling you that the conditions for high-conviction momentum trades do not currently exist — and that sitting in cash is the highest-probability position today."
The zero count is the most misunderstood output the extension produces. New users often see zero results and conclude the tool is broken, the data did not load, or the screeners are too strict. The opposite is true. A zero count means all three independent screeners scanned the full NSE universe of 2,000+ stocks and found no stock simultaneously satisfying all three conditions. This is not a null result — it is a definitive negative result with high informational content. The market is telling you, through three separate independent lenses, that momentum conditions are not present today.
When the All Three tab shows zero results, the correct response is not to reach for the Stage 2 tab and pick the best-looking stock from there. Relaxing the criteria to force a trade on a zero-count day means overriding the intersection logic that makes the All Three tab valuable in the first place. The absence of intersection IS the signal. Respect it. The edge momentum strategies provide comes precisely from being selective about when you trade.
The Score Column — Reading Signals Across All Tabs
Every row in every tab of the Finmagine Trader dashboard displays a Score pill — a number from 1 to 4. The Score represents the total number of scan signals the stock currently passes simultaneously. A stock with Score 4 passes all four screeners: Stage 2, Near 52W High, High Volume, and VCP. A stock with Score 3 passes three of the four. Score 2 passes two. Score 1 passes only the screener whose tab you are currently viewing.
The Score column is valuable precisely because it lets you surface All Three candidates from any tab. If you are browsing the Stage 2 tab and see a stock with Score 3, that stock is also in the Near 52W High and High Volume screeners — it is an All Three stock, visible from the Stage 2 tab because Stage 2 is one of its three signals. If you are in the Near 52W High tab and see a stock with Score 1, that stock passes Near High only — it is the weakest conviction setup on the page.
On any tab, sort by Score descending to surface the highest-conviction stocks at the top of the list. A Score 4 stock anywhere in the dashboard is an All Three stock that also passes VCP — the rarest and highest-conviction combination. A Score 3 stock in any non-All-Three tab is an All Three candidate. A Score 1 stock has no corroboration from any other screener — the lowest conviction single-signal setup.
Score 4 is displayed in gold to make it visually distinctive. Score 3 is displayed in green. These color cues allow rapid visual scanning of any tab — your eye goes immediately to the gold and green pills without needing to read every row. In a full Stage 2 tab with 153 stocks, sorting by Score descending and scanning the gold and green rows gives you the All Three and near-All-Three candidates in seconds.
Understanding what Score means also clarifies what the All Three tab is: it is simply a pre-filtered view of the full dashboard showing only stocks where Score is 3 or higher across the Stage 2, Near High, and High Volume signals. You could replicate the All Three tab from any other tab by sorting by Score descending and filtering for stocks where all three of those specific signals are active. The All Three tab exists as a dedicated view because it is the most frequently referenced starting point for daily momentum research.
All Three vs Stage 2 + Near High — Choosing Your Starting Point
The two most similar tabs in the Finmagine Trader dashboard are All Three and Stage 2 + Near High. Both require Stage 2 and Near 52W High simultaneously. The difference is the third signal: All Three also requires High Volume — today's institutional activity confirmation. Stage 2 + Near High does not. This single difference determines when you should use each tab.
Stage 2 + Near High returns approximately 36 stocks on a typical day. These are stocks in a confirmed institutional uptrend with no overhead supply — strong candidates for watchlist building and swing trade research. But among those 36 stocks, some are sitting in a clean base with no particular catalyst today. Some are extended after a multi-week run. Some have not had a meaningful volume day in two weeks. They are all good setups in principle; they are not all actionable today.
All Three returns approximately 6 stocks. These 6 are a subset of the 36 where something is happening in today's session — institutions are buying the stock actively right now, not just historically. The High Volume confirmation is a same-day filter that identifies which of the 36 Stage 2 + Near High stocks are experiencing current institutional engagement.
Building a 2-week watchlist of pre-breakout candidates? Use Stage 2 + Near High (~36 stocks). These are the stocks to set price alerts on and monitor for the setup to mature.
Deciding what to research THIS morning before the session? Use All Three (~6 stocks). These are the stocks where something is happening today — institutional activity is confirmed in the current session. Start here. Chart these first. Check if the setup is clean or extended.
The practical workflow is to use both in sequence. Check All Three first every morning — these are the immediate action items. Then browse Stage 2 + Near High to identify stocks that are not in today's All Three but are building toward a potential All Three appearance in coming sessions. Star the most interesting Stage 2 + Near High candidates in the watchlist, set price or volume alerts, and wait for them to trigger. When they trigger and the stock appears in All Three, the setup has matured to the point where full chart analysis is warranted.
Buy High, Sell Higher: Why This Strategy Works
The most common instinct among retail investors is to buy stocks that have come down. "It was ₹500 last month and it's ₹350 now — it's on sale." This feels rational. It mirrors how we shop for everything else. A television that costs ₹40,000 last week and ₹32,000 this week is genuinely a better deal. We are evolutionarily wired to seek discounts.
The stock market punishes this instinct systematically. A stock is not a television. A falling price does not mean better value — it means the market's collective judgment, expressed through every participant's capital, has shifted lower. And every step down the price ladder creates something that televisions do not have: overhead resistance.
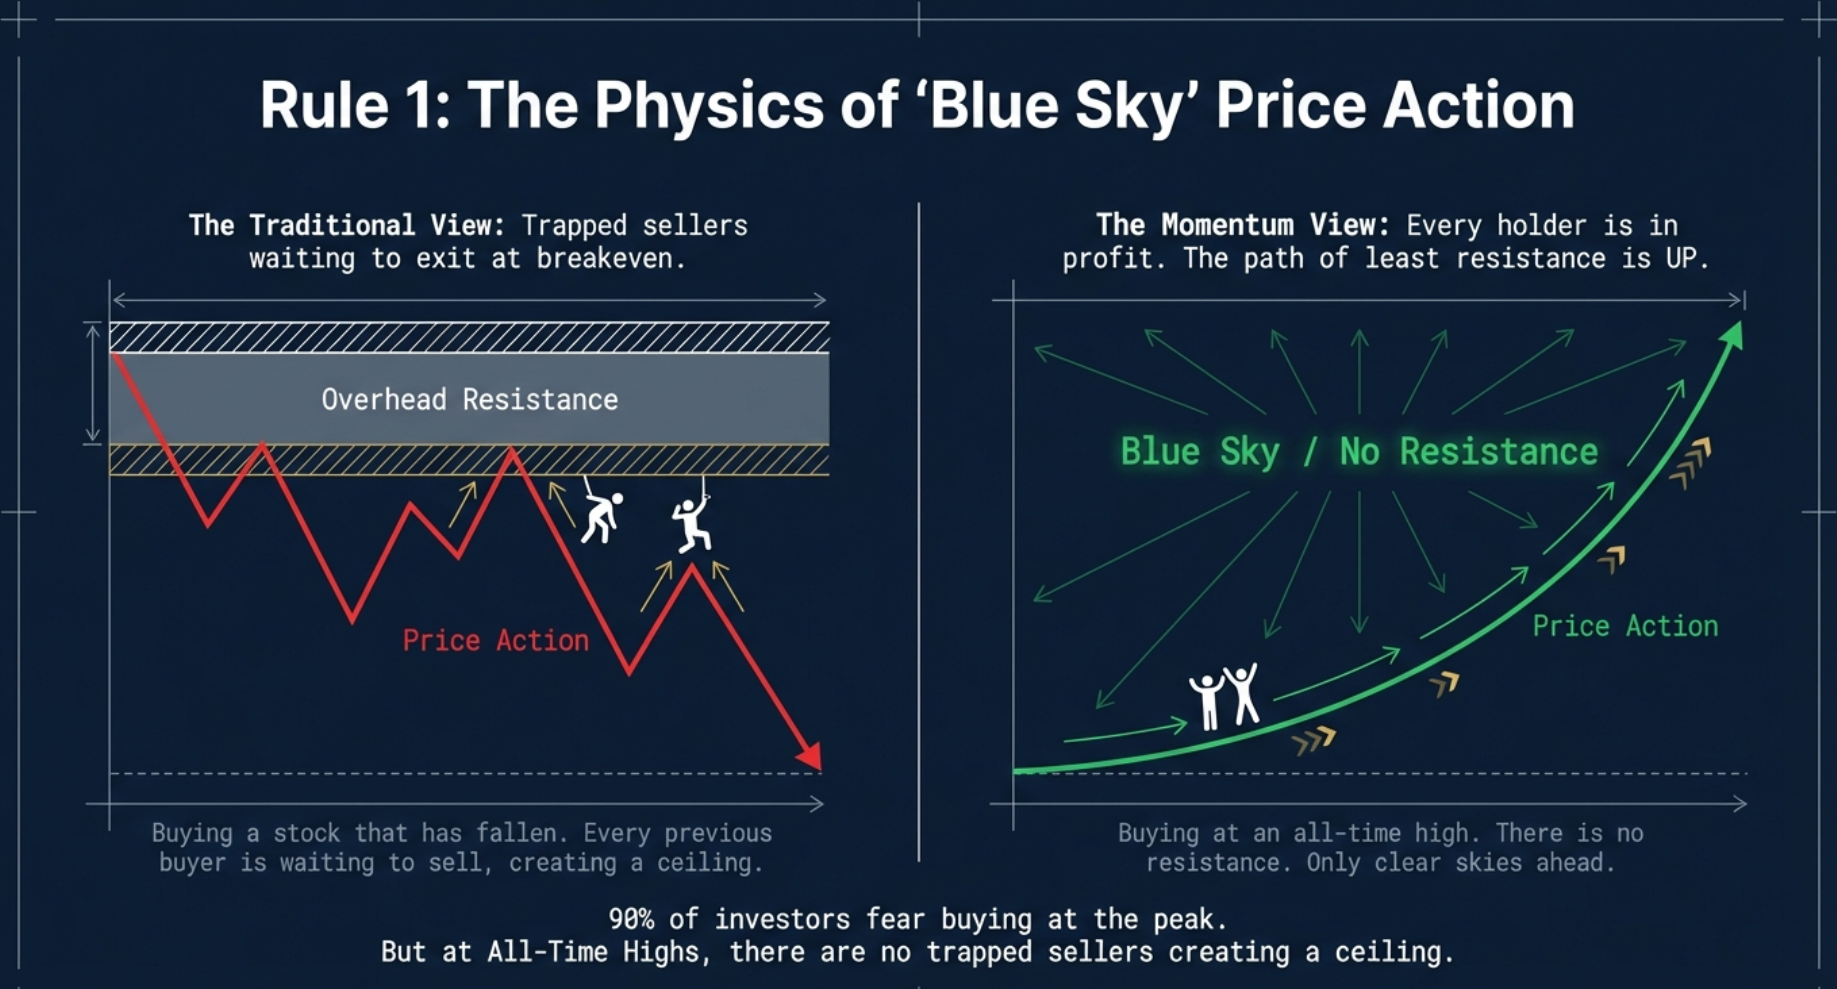
The Bargain Hunter's Trap
When a stock falls from ₹100 to ₹70, consider who is holding it. Every investor who bought anywhere between ₹71 and ₹100 is now sitting on a loss. They did not plan to hold a losing position — they planned to sell when the stock recovered. As the stock attempts to rally from ₹70 back toward ₹80, then ₹90, then ₹100, each price level encounters a wall of sellers: investors who bought at that level, are finally breaking even, and are desperate to exit. This is overhead resistance — invisible to most retail traders, but as real as a physical ceiling.
Overhead Resistance Explained
Every price point between the current price and a previous high represents trapped buyers. They are not selling because they believe in the company. They are selling because they have been waiting, sometimes for months or years, to get their money back. A stock that fell from ₹200 to ₹80 and is now rallying must fight through ₹90 sellers, ₹100 sellers, ₹110 sellers, and so on — at every step. This is why fallen stocks so often stage spectacular rallies that fade just when they seem to be working: they run into the brick wall of trapped sellers at each prior level.
Blue Sky Territory
Now consider a stock that breaks to an all-time high. Every single person who owns the stock is in profit. There are no trapped sellers anywhere above the current price. No one needs to sell at break-even. The only sellers are profit-takers, who by definition have discretion over when they sell — they are not forced. The path of least resistance is upward. There is no historical resistance anywhere above. This is "blue sky" territory — open sky as far as price is concerned, with no prior supply to fight through.
This is the foundational logic behind buying near 52-week highs and all-time highs. It is not buying because it "looks strong." It is buying because the structural supply overhang that creates friction in every other price region simply does not exist above the prior high.

The Mathematical Proof
It is literally impossible for a stock to deliver a 300%, 500%, or 1,000% return without continuously making new all-time highs. Every major multi-bagger in Indian market history — every stock that went from ₹50 to ₹500, or ₹100 to ₹2,000 — passed through price levels that "felt too expensive" on the way to the top. An investor who refused to buy any stock at an all-time high would have missed every one of those returns. Excluding all-time highs is, mathematically, excluding every multi-bagger.
This Gujarati phrase — widely used among Indian market traders — captures a profound truth: the price of a stock at any moment is the market's composite judgment of all available information from all participants. Millions of investors, analysts, institutions, and algorithms have collectively set this price with real capital at risk. When price breaks to a new all-time high, the market is collectively declaring a new, higher fair value — not a temporary spike, but a genuine reassessment by everyone participating with real money. That declaration, backed by actual capital flows, is the strongest signal that exists. Arguing with it based on valuation ratios or historical price is arguing with the collective judgment of every market participant simultaneously.
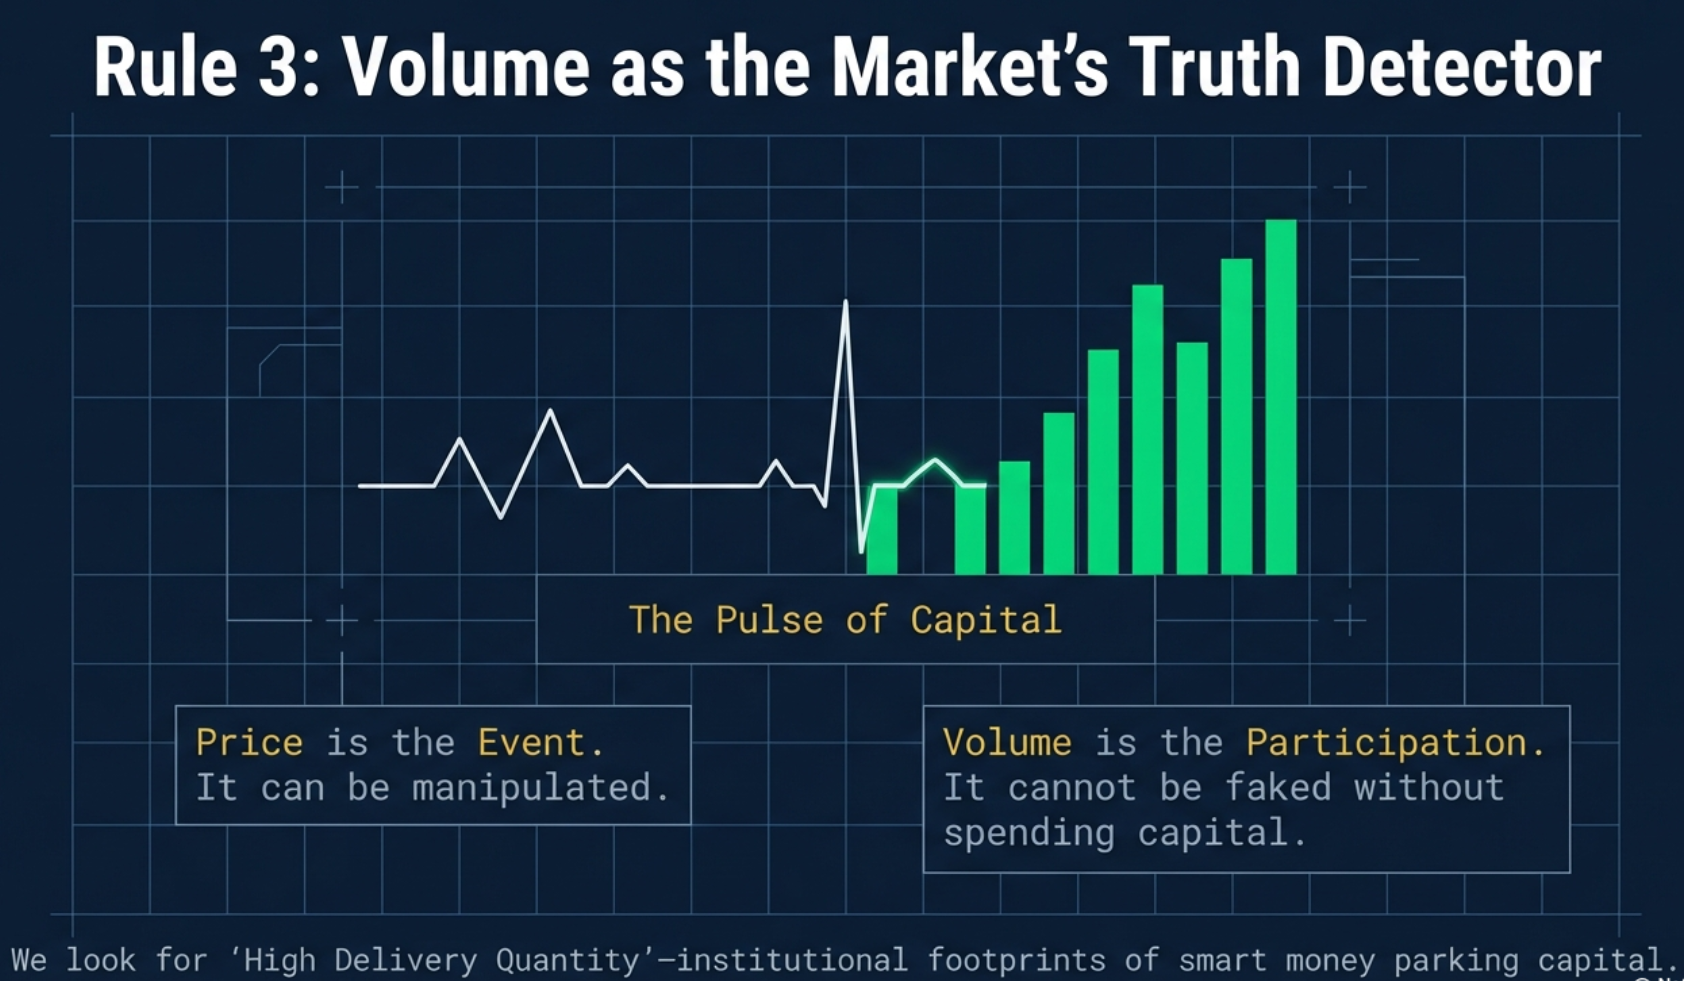
Volume: The Market's Truth Detector
Price is visible. Volume is honest. A stock's price can be moved by a single large order in thin-market conditions — one institutional seller or buyer temporarily pushing price up or down by creating an imbalance. But volume cannot be faked at scale. Every share that changes hands required real capital — a buyer transferred money to a seller. You cannot manufacture 10 million shares of genuine two-sided trading without spending 10 million × price in actual money.
This is why volume is called the market's truth detector. When price moves on high volume, the move has genuine capital backing it. When price moves on low volume, the move may be ephemeral — a temporary imbalance with few real participants. The High Volume rule in the All Three signal uses this principle to distinguish genuine institutional buying from noise.
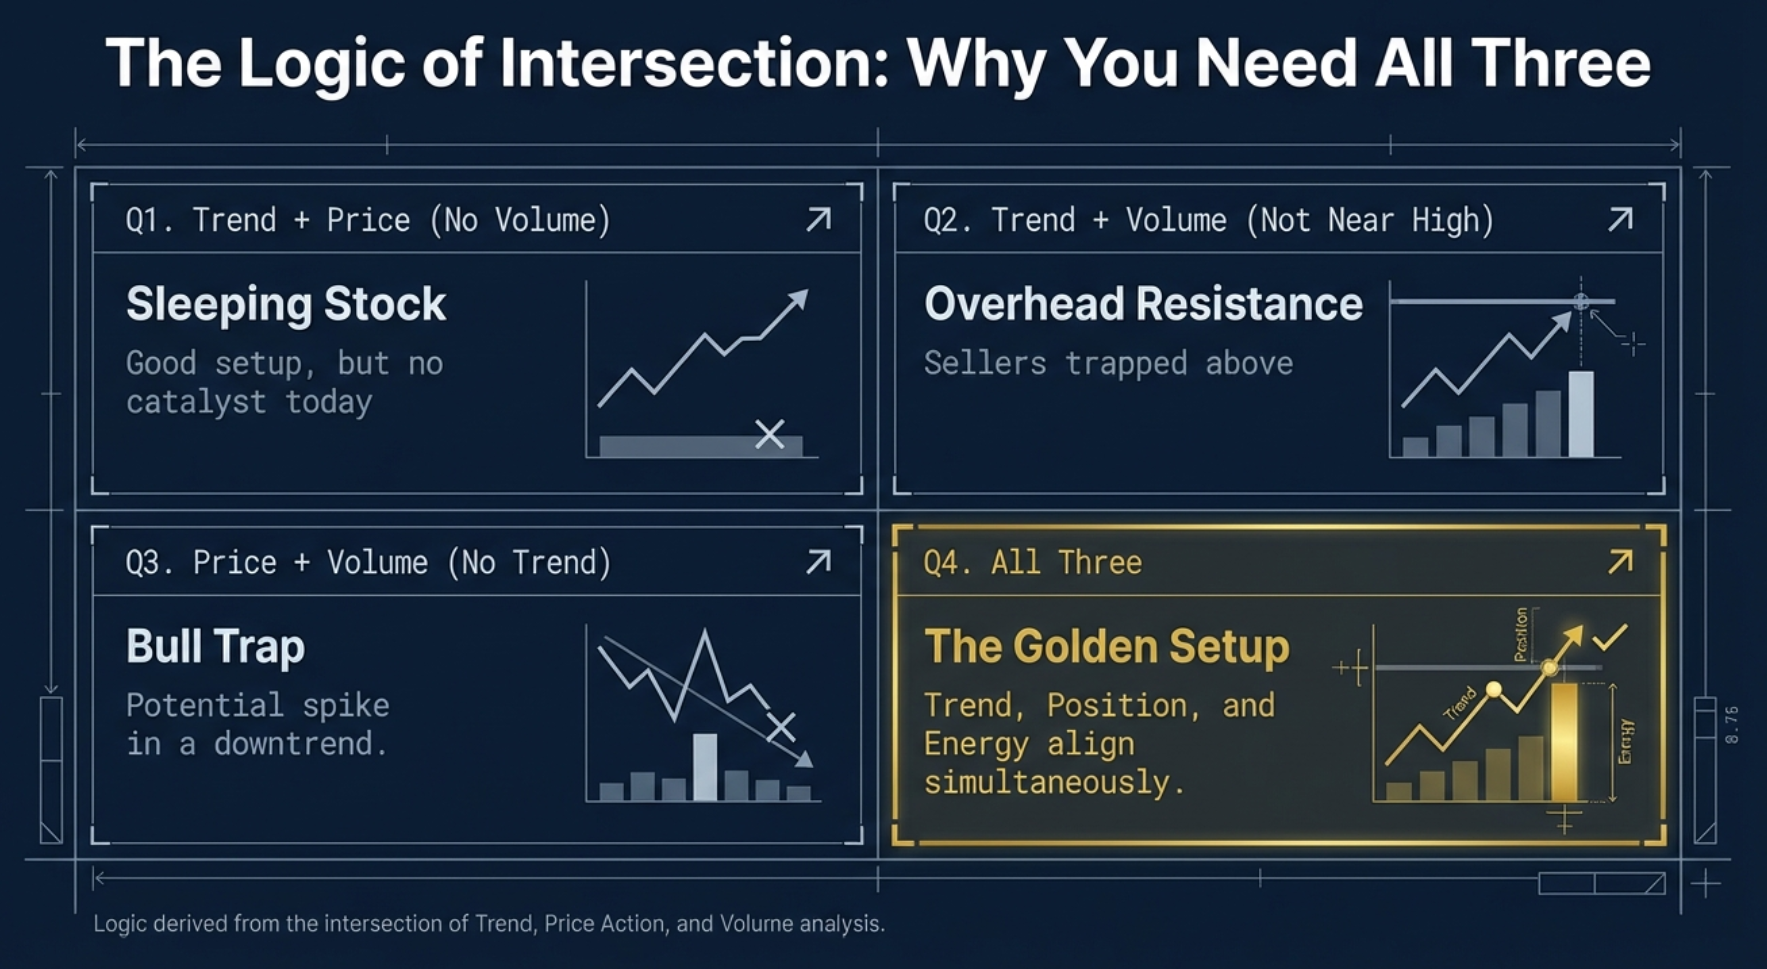
The Four Price-Volume Cycles
There are four possible combinations of price direction and volume direction. Each tells a different story about market health:
| Price Direction | Volume Direction | Cycle Type | What It Means |
|---|---|---|---|
| Rising | Rising | Healthy Uptrend | Everyone is buying. Real capital is flowing in. The move is sustained and institutional in nature. This is the pattern the High Volume rule is designed to identify. |
| Rising | Falling | Weak Uptrend / Bull Trap | Price is rising but buyers are thinning. The fuel for the rally is running out. Latecomers may be driving price up as early buyers quietly exit. This is dangerous — the rally can reverse suddenly when the last buyer arrives. |
| Falling | Rising | Healthy Downtrend | A decline on rising volume confirms selling pressure is real and broad-based. This validates the downtrend — many participants are selling, not just a few. The move is likely to continue. |
| Falling | Falling | Weak Downtrend | Sellers are exhausted. The decline is continuing but on diminishing selling interest. This can signal potential base-building ahead — the downtrend may be losing momentum as fewer and fewer sellers remain. |
The Accumulation Base
Large institutions — mutual funds, insurance companies, foreign portfolio investors managing thousands of crores — cannot buy a stock the way retail investors do. If a large fund wants to acquire a ₹500 Crore position in a stock, it cannot simply send one large order: the order itself would spike the price and the institution would end up buying its later shares at higher prices than its first shares, averaging up its cost to a terrible level.
Instead, institutions accumulate quietly. They buy during boring sideways phases when retail traders have given up watching the stock. They spread their buying over days, weeks, sometimes months — absorbing shares when sellers appear without driving the price up visibly. The stock "goes nowhere" for weeks while a major institutional position is quietly being built. Then, when the institution has accumulated enough and triggers the final buy, the stock breaks out on massive volume. This is the accumulation base and the volume-confirmation breakout — the exact pattern the High Volume screener is designed to detect.
Delivery Quantity vs Delivery Percentage
Many traders make a critical error when interpreting volume data: they focus on delivery percentage rather than delivery quantity. "This stock had 80% delivery — strong conviction buying." But 80% of what?
80% delivery on 10,000 shares traded means only 8,000 shares changed hands permanently — a trivial amount in absolute terms for any institutional player. However, a stock that trades 1,00,00,000 shares (one crore shares) with only 18% delivery has delivered 18,00,000 shares permanently to new holders. That is an enormous absolute quantity of stock changing hands, regardless of the low delivery percentage.
You cannot manufacture 10 million shares trading hands without spending 10 million × the stock price in real money. A stock priced at ₹200 trading 1 crore shares requires ₹200 Crore of real capital flowing through it in a single session. This is the volume rule's deepest truth: it is the only one of the three All Three signals that directly measures the flow of real institutional rupees on the current day, not historical patterns or price ratios. When volume surges, follow the money — because real money moved it.
The Three-Step Entry Pattern and the 200 EMA Exit Rule
Understanding which stocks to research is only the first half of the process. The second half is knowing when to enter, how much to buy, and when to exit. The momentum framework that works with the All Three signal has a specific entry pattern and a non-negotiable exit rule.
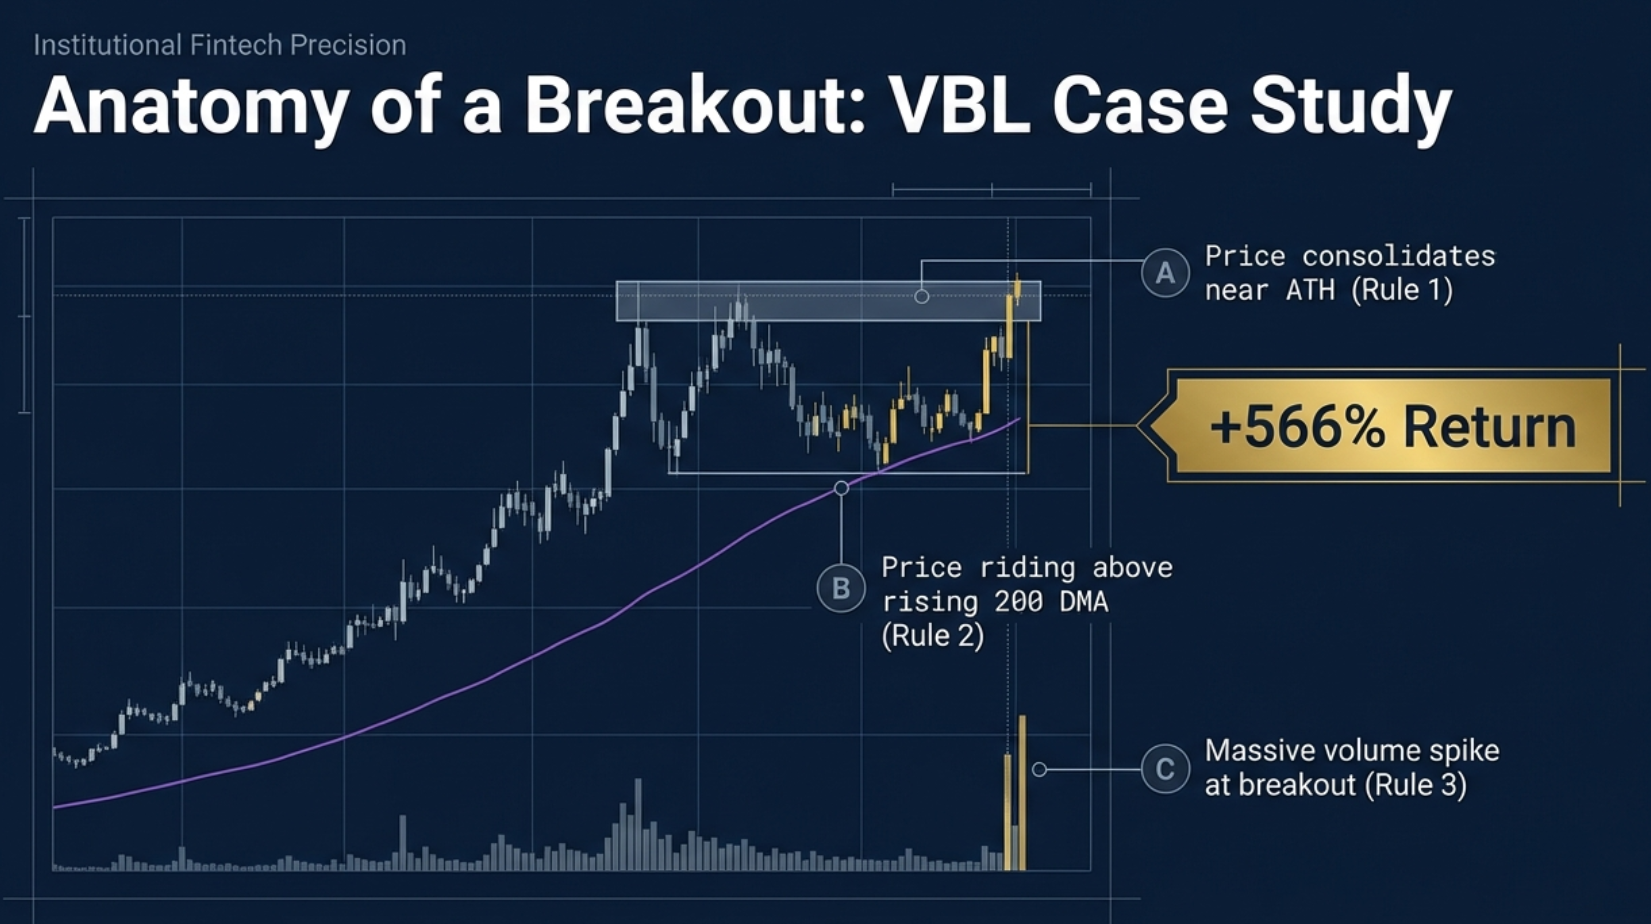
The Three-Step Breakout Pattern
The highest-quality All Three setups often follow a recognisable three-step chart pattern. Learning to identify this pattern on a chart turns a screener output into a high-probability entry candidate.
The Dip
The stock was previously trading BELOW its 200-day moving average. This is a shakeout phase — weak hands sold, the stock was "out of favor," retail investors abandoned hope. Institutions were quietly absorbing shares from panic sellers at low prices.
The Rocket Recovery
The stock recovers sharply ABOVE the 200-day moving average, often in a compressed timeframe. Institutional buying returns visibly. Volume accompanies the recovery. The stock reclaims its long-term trend line decisively, not tentatively.
The ATH Breakout
The stock breaks its previous all-time high. This is the entry trigger — buy exactly as price clears the prior historical ceiling. Above the ATH, there is zero historical resistance. No prior buyer is underwater. The path of least resistance is purely upward.
IPO Breakout Variant
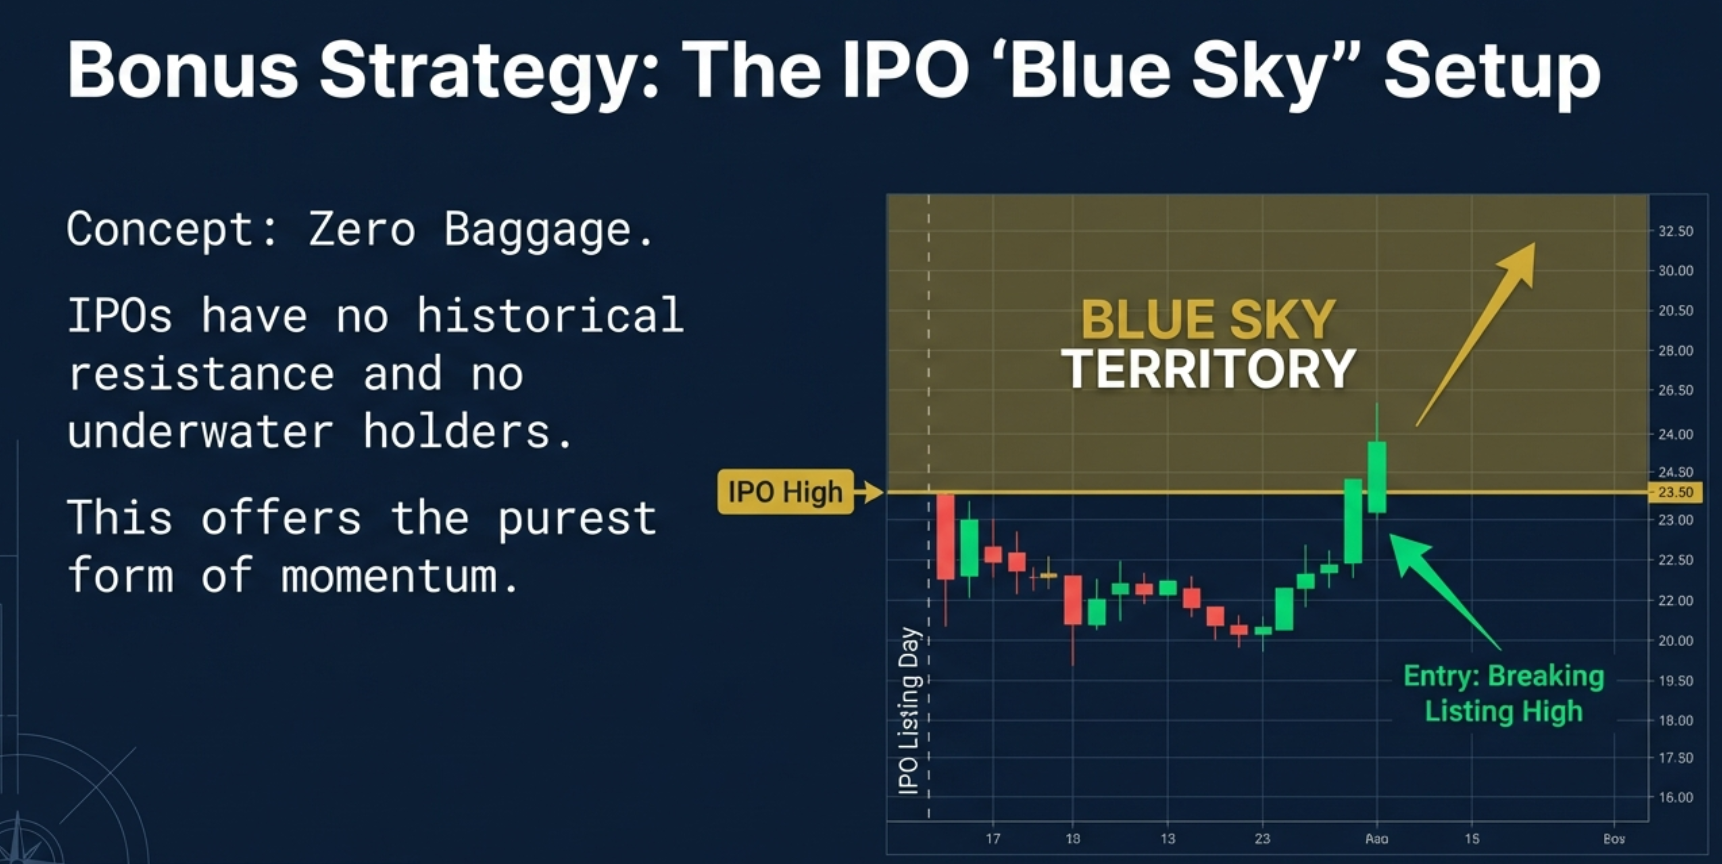
For recently listed stocks, an equivalent setup exists without requiring an all-time high in the traditional sense. After a stock lists on the exchange, it often consolidates for days or weeks as early investors take profits and the market finds its equilibrium. The listing day's high becomes the equivalent of the "all-time high" for the stock's short history.
The IPO breakout strategy: wait for the newly listed stock to consolidate after listing, then buy when it breaks above its initial listing-day high for the first time. This setup offers zero overhead resistance (no history above the listing high), no lottery luck required (buy as much as you want in the open market at the trigger price), and a clean, definitive entry trigger. Many of the strongest multi-year momentum runs begin with an IPO consolidation and then a breakout above the listing-day high.
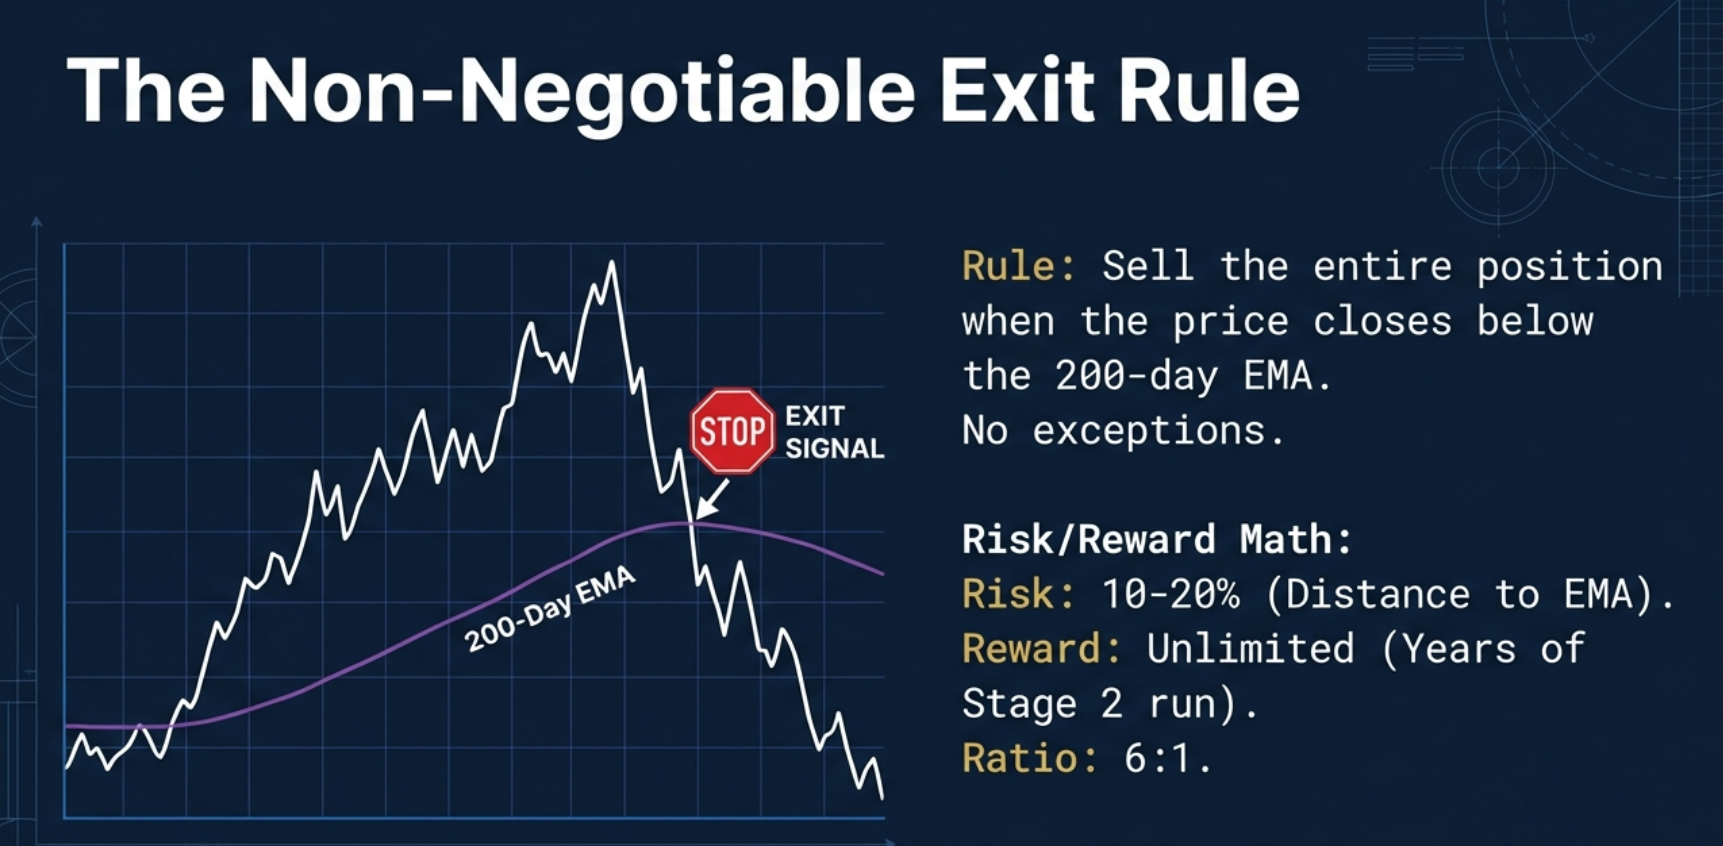
The 200 EMA Exit Rule
This is non-negotiable. If any momentum position closes BELOW the 200-day Exponential Moving Average (EMA), sell the entire position on that day's close or the next morning's open. No exceptions. No "let's wait one more day to see if it recovers." No holding through "just a brief dip."
Why the 200-day EMA specifically? Because the 200-day EMA is the long-term institutional trend line. A close below it means the institutional uptrend that made the stock an All Three candidate has ended. The same institutions whose buying created the Stage 2 uptrend are no longer supporting the price above this level. The analytical basis for holding the position — the trend — is broken.
The 200-day EMA at the time of entry is typically 10–20% below the entry price. This defines your maximum loss on any trade: if you enter at ₹200 and the 200-day EMA is at ₹170, your maximum loss is ₹30 per share (15%). You will not lose more than this unless you override the exit rule.
Most retail traders do the exact opposite of what momentum strategy requires. They sell winners too early — locking in a 15% gain after the stock doubles and then continues to ₹500. They hold losers forever — watching a position fall 30%, 40%, 50% while telling themselves "it will come back." Momentum trading inverts this completely. Cut losers fast at the 200-day EMA — no exceptions, no second chances. Let winners run as long as they stay above it — months, even years. Discipline in these two rules determines results more than any other single factor, including which stocks you choose.
The Asymmetric Risk-Reward
The 200 EMA exit rule creates an asymmetric risk-reward profile that is the foundation of momentum strategy profitability. Your downside on any single trade is bounded: 10–20%, depending on how far the 200 EMA is below your entry. Your upside is unbounded: if the Stage 2 uptrend continues — and the best ones continue for 1–3 years — returns of 100%, 200%, 500% are mathematically possible on that position.
This means you can be wrong on 5 out of 6 trades and still come out ahead in absolute rupee terms, as long as the one winner runs 10× while your five losers each lose 15%. The strategy does not require a high win rate. It requires correctly executing the exit rule on losers (cutting quickly) and the staying rule on winners (holding patiently as long as the 200 EMA holds).
Position Sizing Formula
Before entering any momentum trade, calculate the position size using this formula:
Maximum Quantity = Maximum Acceptable Loss ÷ Risk Per Share
Risk Per Share = Entry Price − 200-day EMA Level
Example: Maximum acceptable loss for this trade: ₹5,000. Stock entry price: ₹200. 200-day EMA level: ₹180. Risk per share: ₹200 − ₹180 = ₹20. Maximum quantity: ₹5,000 ÷ ₹20 = 250 shares. Total position value: 250 × ₹200 = ₹50,000.
7–10 Concurrent Positions
The momentum framework is designed to be run as a portfolio of simultaneous positions, not as concentrated single-stock bets. Hold 7–10 different momentum trades simultaneously. The logic is diversification across uncorrelated outcomes: if one position hits the 200-day EMA and you take a 15% loss on that trade, the other 6–9 positions are still running. No single trade can blow up the portfolio. And when one of those 7–10 positions turns into a 3-year 500% winner, the portfolio returns reflect that winner's full compounding — not a situation where you sold it after a 30% gain because "it felt like enough."
What All Three Is Not — Common Mistakes
The All Three tab is designed to surface the day's highest-conviction momentum candidates. Understanding what it is not — and the mistakes that arise from misunderstanding it — is as important as understanding what it does.
- All Three is not a buy signal. It identifies stocks meeting three simultaneous technical criteria. It does not tell you to buy any of them. Whether to buy a stock on the All Three list depends on chart structure, entry trigger price, available position size, and your specific risk management rules. A stock can appear in All Three and be extended 25% above its base — technically valid but not a good entry point.
- All Three does not guarantee results daily. On zero-count days, there are no high-conviction momentum candidates by the intersection definition. That is a valid and informative output, not a failure. Expect zero-count days regularly during corrections, sideways markets, and periods of narrow sector participation.
- All Three does not rank the stocks within the list. The 6 stocks in the All Three tab are not ordered from best to worst opportunity. They all pass the same three filters. Determining which of the 6 has the cleanest chart setup, best reward-to-risk ratio, and most sensible entry point requires chart analysis — the screener cannot do that for you.
- All Three is not sufficient alone. Even for a stock on the All Three list, you still need: chart structure assessment (is it at a clean base or extended?), a specific entry trigger (the price at which you would initiate a position), position sizing (how much to risk based on your stop-loss distance), and an exit plan. The screener is the first filter. Chart analysis and risk management complete the process.
- All Three is not a replacement for understanding the underlying criteria. Knowing that a stock is in All Three is most useful when you understand what Stage 2, Near High, and High Volume each mean individually. If you do not understand what each signal confirms — and what each cannot confirm alone — the All Three output becomes a black-box list rather than a meaningful analytical output.
The All Three tab is a pre-filtered starting list. It answers the question "which stocks are worth examining today?" It does not answer "should I buy this stock?" Those are fundamentally different questions. The screener performs the filtering. The trader performs the analysis. Both steps are necessary. Skipping the analysis step and acting directly on screener output is the single most common error made with momentum screening tools.
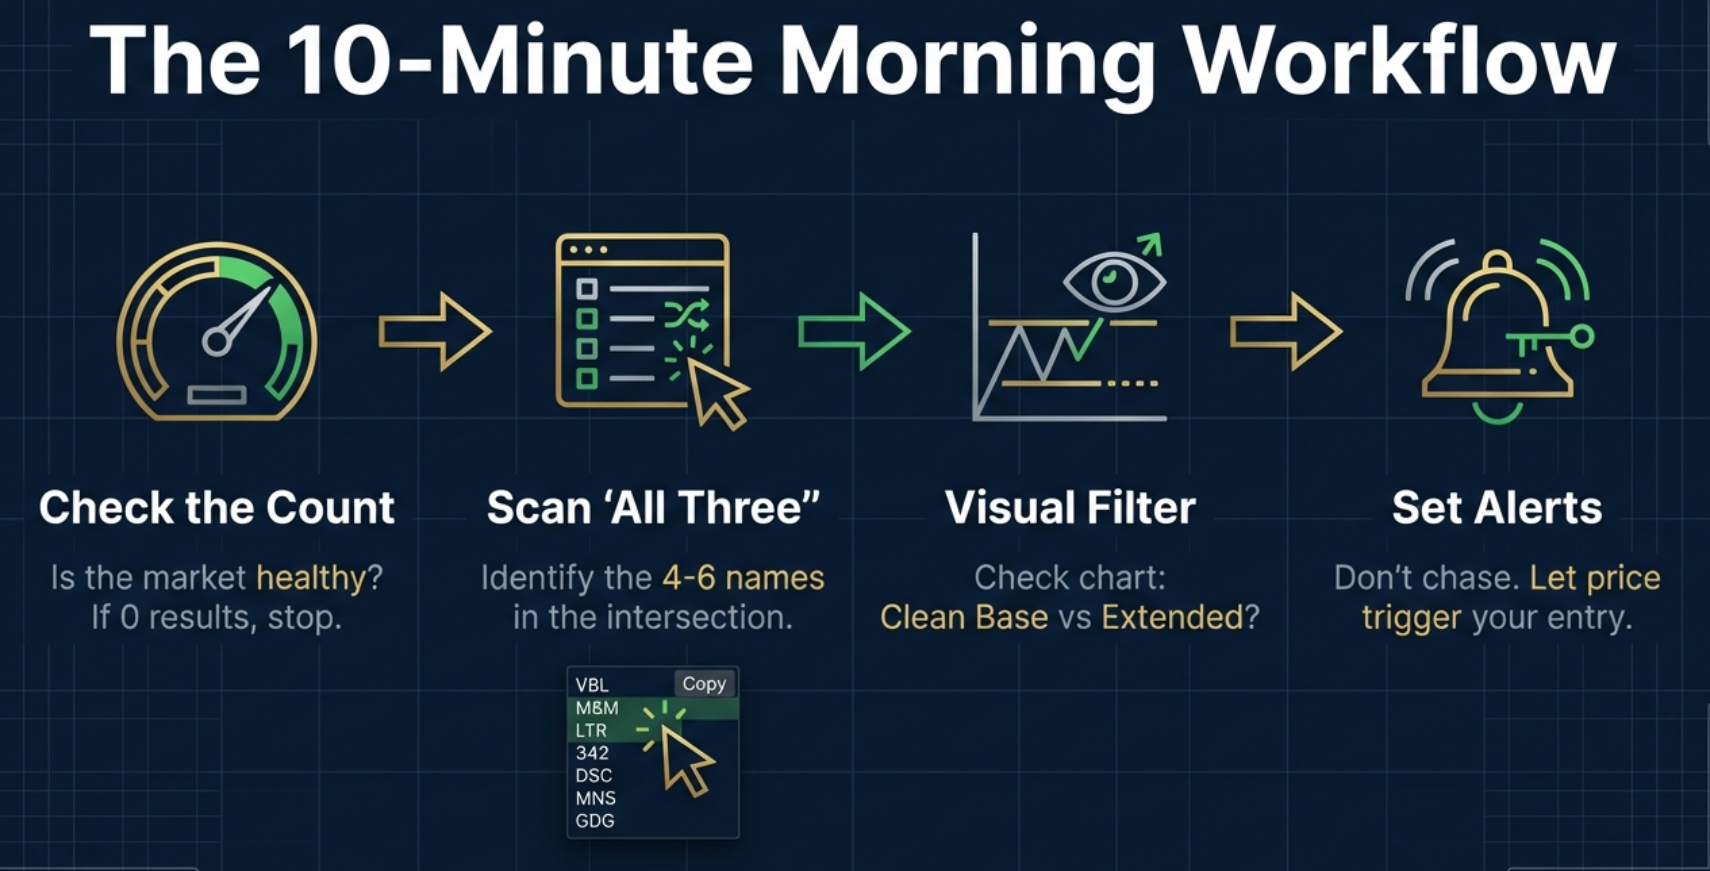
The All Three Morning Workflow
The practical value of the All Three tab is maximised when it is embedded in a consistent daily process. Here is a repeatable three-step morning workflow that uses the All Three tab as its primary decision filter.
Check the Count
Open the Finmagine Trader extension. The All Three tab loads by default. Read the count immediately. If 0: protect capital today. Do not proceed to Stage 2 to find an alternative. Zero is the signal. Close the extension and focus on managing existing positions, not initiating new ones. If 4–8: proceed to step 2.
Chart Each Stock
For each stock in the All Three list: click the TV button to open TradingView. Ask two questions: Is the stock at a clean base or extended from one? Is there a specific, well-defined entry point with a clear stop-loss level below it? Mark the answer. A stock that is extended 20% above its last base is still technically in All Three but may not be a good entry today — note it for monitoring.
Watchlist and Alerts
Clean setups — stocks at or near a base with a definable entry — get starred in the watchlist. Use Copy Symbols to copy all All Three tickers in NSE:SYMBOL format, then paste into TradingView's watchlist import to set price alerts. Extended stocks go onto a monitor list for when they pull back or form a new base. The morning workflow is complete. Total time from extension open to TradingView alerts: 5–10 minutes.
The All Three tab is also valuable after the close (3:30 PM onward) when the day's data is final and stable. After-hours chart review of the All Three stocks without the pressure of live prices often produces clearer analysis. Build tomorrow's alert list from today's All Three results during the post-session period for the calmest, most considered research environment.
See The All Three Signal Live
Open Finmagine Trader and check today's All Three count — the single most useful daily momentum health indicator for Indian markets.
Open Finmagine Trader — Free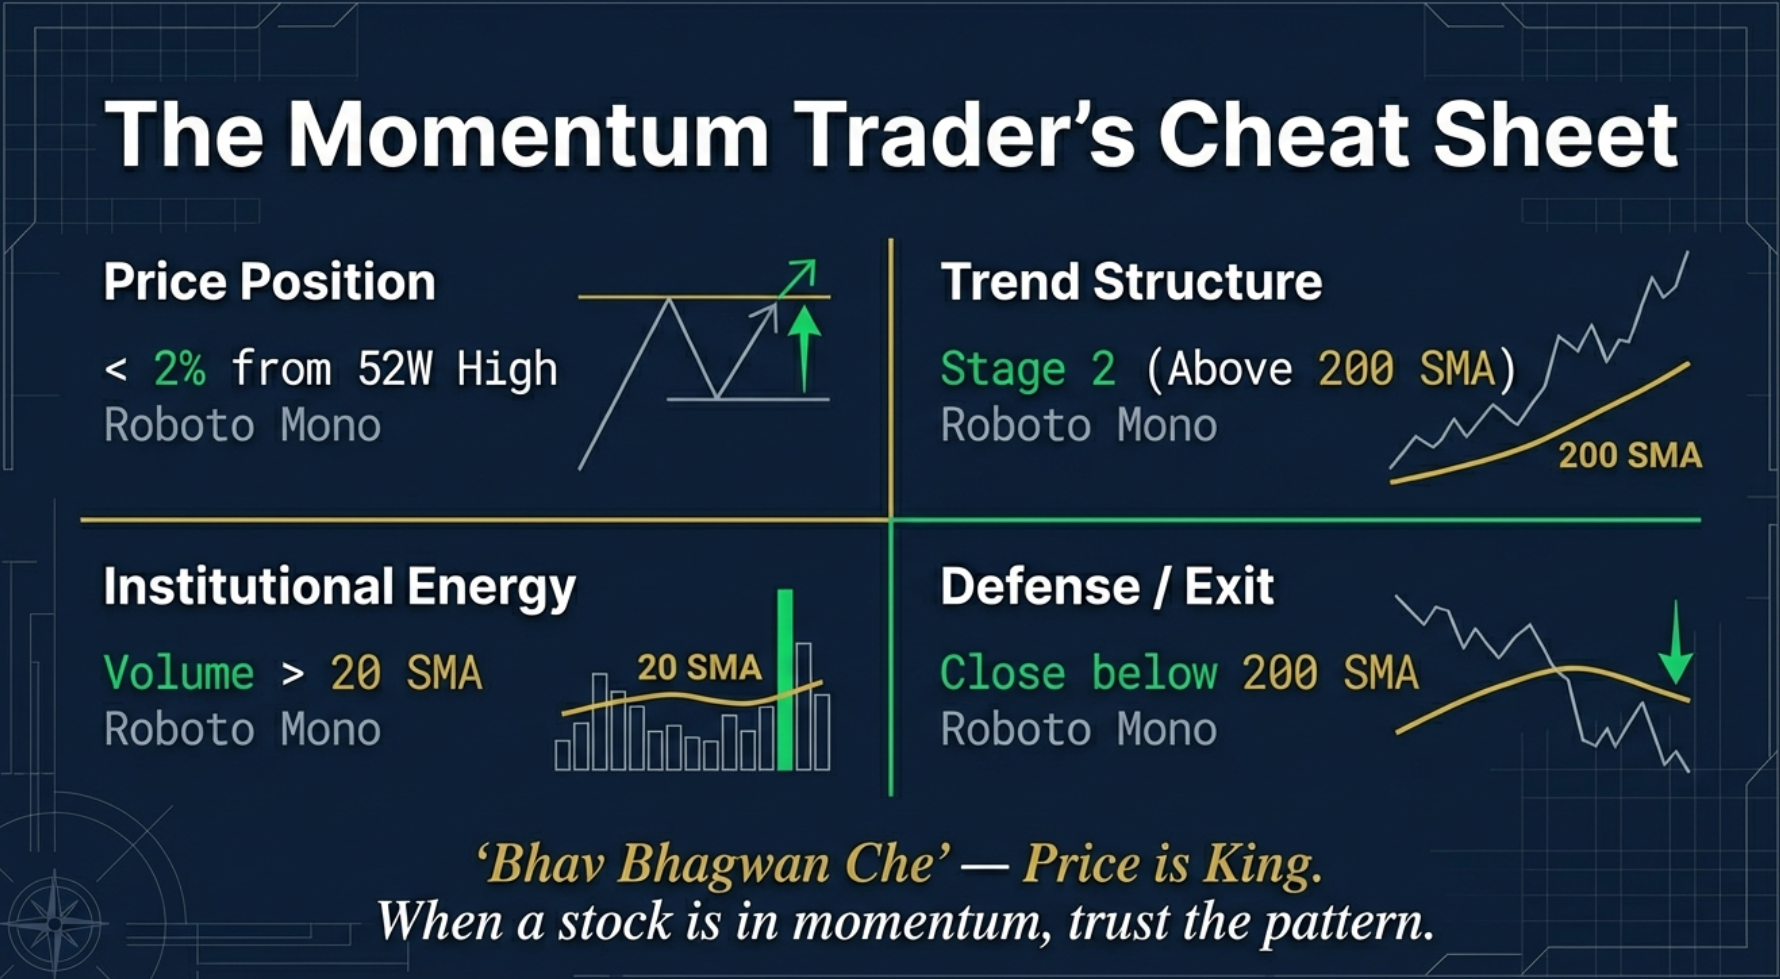
Free Chrome Extension
Ready to scan your first momentum list?
Install Finmagine Trader and scan 2,000+ NSE stocks for Stage 2 uptrends, VCP breakouts, near 52-week highs, and volume surges — in one click.
Install from Chrome Web Store →No account required • Works on Chrome, Edge, Brave • NSE stocks only
Continue the Finmagine Trader Series
Explore the other articles in this series to understand each tab's methodology in depth:
Introducing Finmagine Trader Stage 2 Uptrend Explained VCP Breakout Methodology TradingView Workflow Tight Volatility Filter (v1.4.0)The All Three Signal — Frequently Asked Questions
The most common questions about the All Three tab, answered in detail. Click any question to expand the answer.