Momentum Breakout Strategy: Buy High, Sell Higher
Master the counter-intuitive momentum trading strategy that delivered explosive returns: 566% on VBL, 13.79% on Bharti Airtel while markets stayed flat. Learn the 3-step system for buying all-time highs and riding Stage 2 momentum.
3-Step System
All-Time High breakouts + Stage 2 analysis + 200-day EMA exits
Proven Results
566% returns on VBL, 13.79% on Bharti Airtel during flat markets
Free Toolkit
Complete implementation guide with screener settings and examples
Momentum Breakout Strategy - Complete Video Guide
Watch the complete walkthrough of the momentum breakout strategy with live examples, screening techniques, and real portfolio results from actual trades.
Video Guide Highlights:
- Live Strategy Demonstration: Step-by-step walkthrough of identifying momentum breakouts using real examples
- Stage 2 Analysis Deep Dive: How to identify stocks in the powerful Stage 2 uptrend phase
- All-Time High Psychology: Why buying at highs works and how to overcome emotional barriers
- 200-day EMA Exit System: Professional exit strategy that protects gains and cuts losses
- Real Trading Examples: Actual trades on VBL, Bharti Airtel, and other momentum winners
- Screening Setup: Exact screener settings to find momentum breakout candidates
Expert Strategy Discussion - Momentum Trading Deep Dive
Listen to the comprehensive analysis of momentum trading psychology, risk management, and real-world implementation challenges with practical solutions.
Expert Discussion Highlights:
- 🧠 Psychology of Buying High: Overcoming the natural fear of buying at all-time highs
- 📊 Stage Analysis Framework: Understanding Mark Minervini's 4-stage cycle and timing entries
- ⚖️ Risk Management Rules: Position sizing, stop-loss placement, and portfolio allocation strategies
- 🎯 Entry Timing Techniques: How to distinguish between true breakouts and false signals
- 💼 Portfolio Construction: Building a momentum-focused portfolio while maintaining diversification
- 📈 Market Environment Analysis: When momentum strategies work best and when to avoid them
🛠️ Your Free Momentum Strategy Implementation Toolkit
Everything you need to start implementing the momentum breakout strategy immediately, including screener settings, checklists, and example trades.
Complete Toolkit Includes:
- 📋 Momentum Screener Settings: Exact parameters for finding all-time high breakout candidates
- ✅ Entry Checklist: 7-point verification system before taking any momentum trade
- 📊 Stage 2 Identification Guide: Visual guide to recognize powerful uptrend phases
- 🎯 Exit Strategy Framework: 200-day EMA rules and profit-taking guidelines
- 💰 Position Sizing Calculator: Risk-based position sizing for momentum trades
- 📈 Trade Examples Library: 10+ real trade examples with entry/exit points
- ⚠️ Red Flag Indicators: Warning signs to avoid false breakouts and momentum traps
🚀 Ready to Start Momentum Trading?
Get instant access to the complete momentum strategy toolkit and start identifying breakout opportunities in the Indian markets.
🤔 Master the Strategy: Interactive Q&A
Test your understanding with 38 comprehensive questions covering every aspect of the momentum breakout strategy. Perfect for exam prep or knowledge retention.
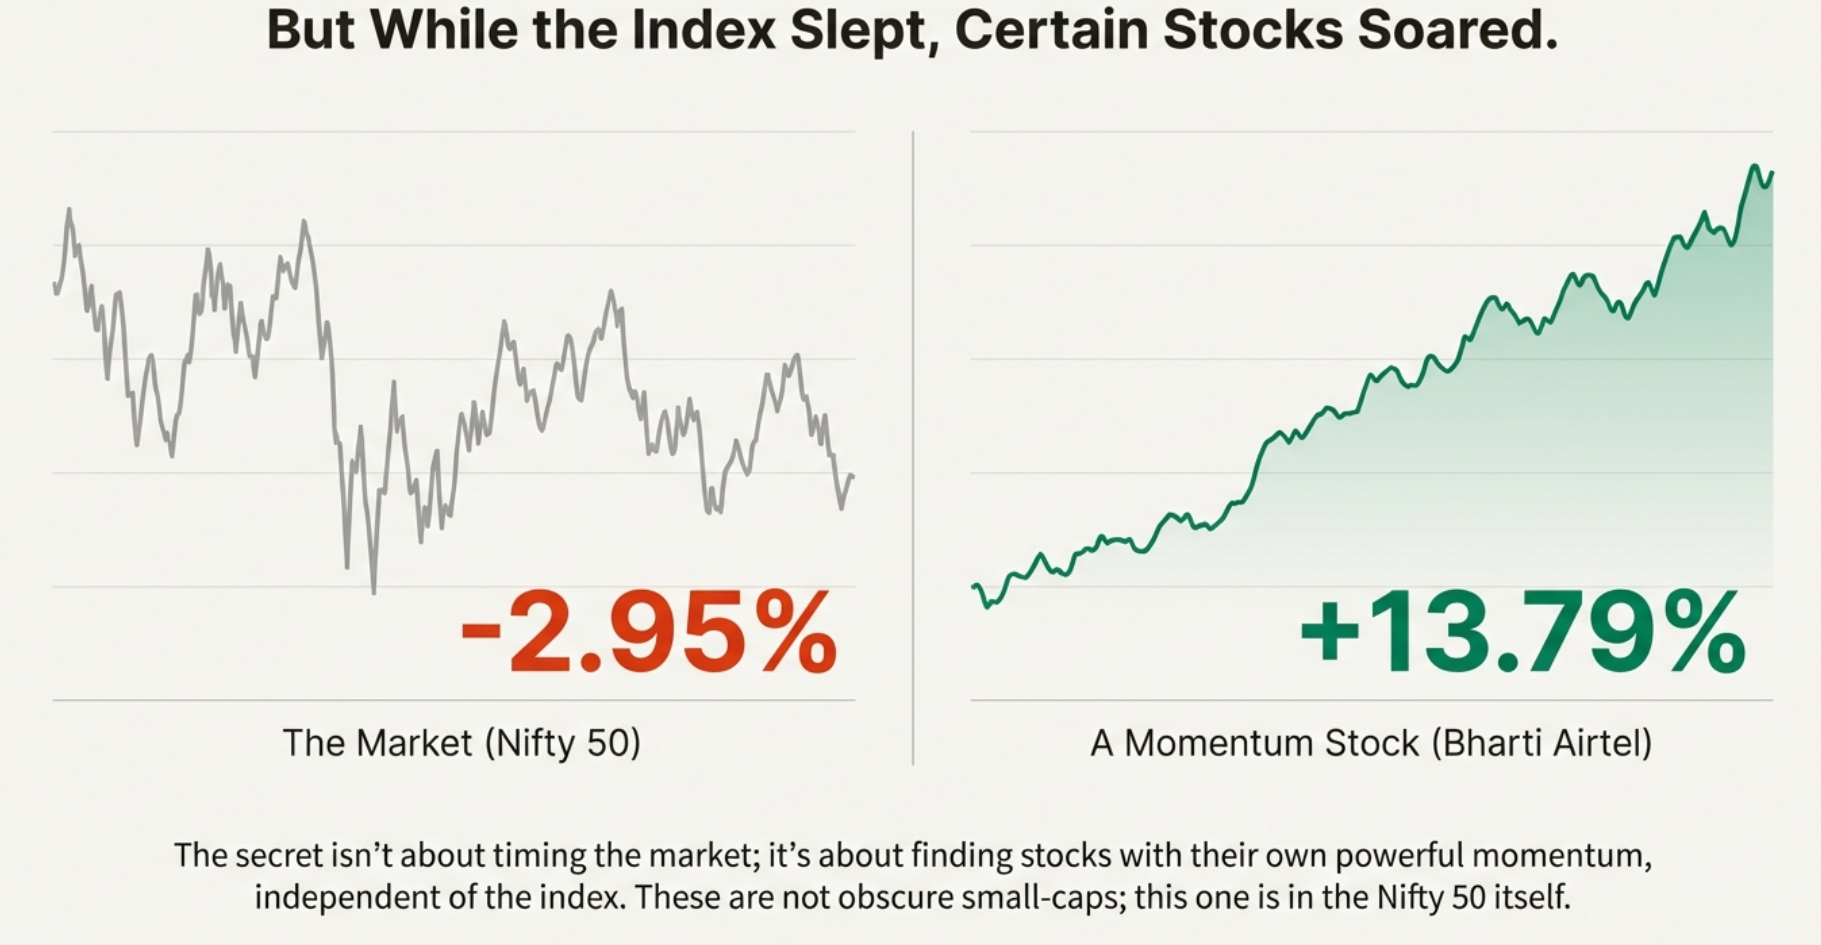
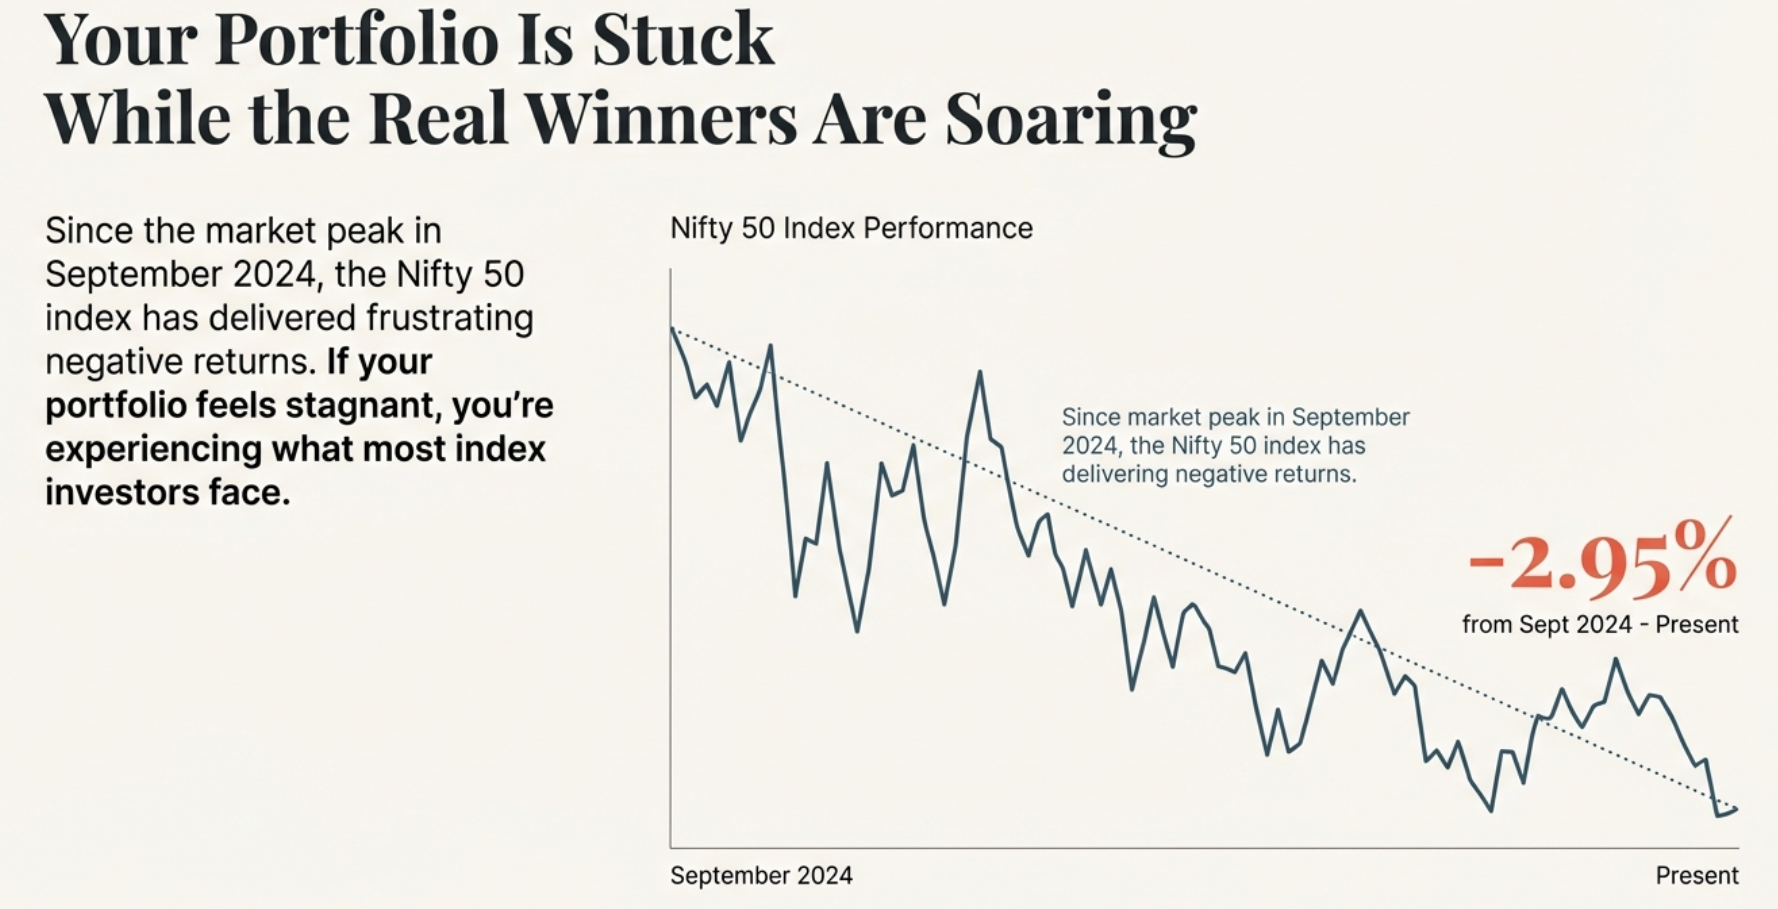
The Market Reality: Your Portfolio is Stuck While Momentum Stocks Soar
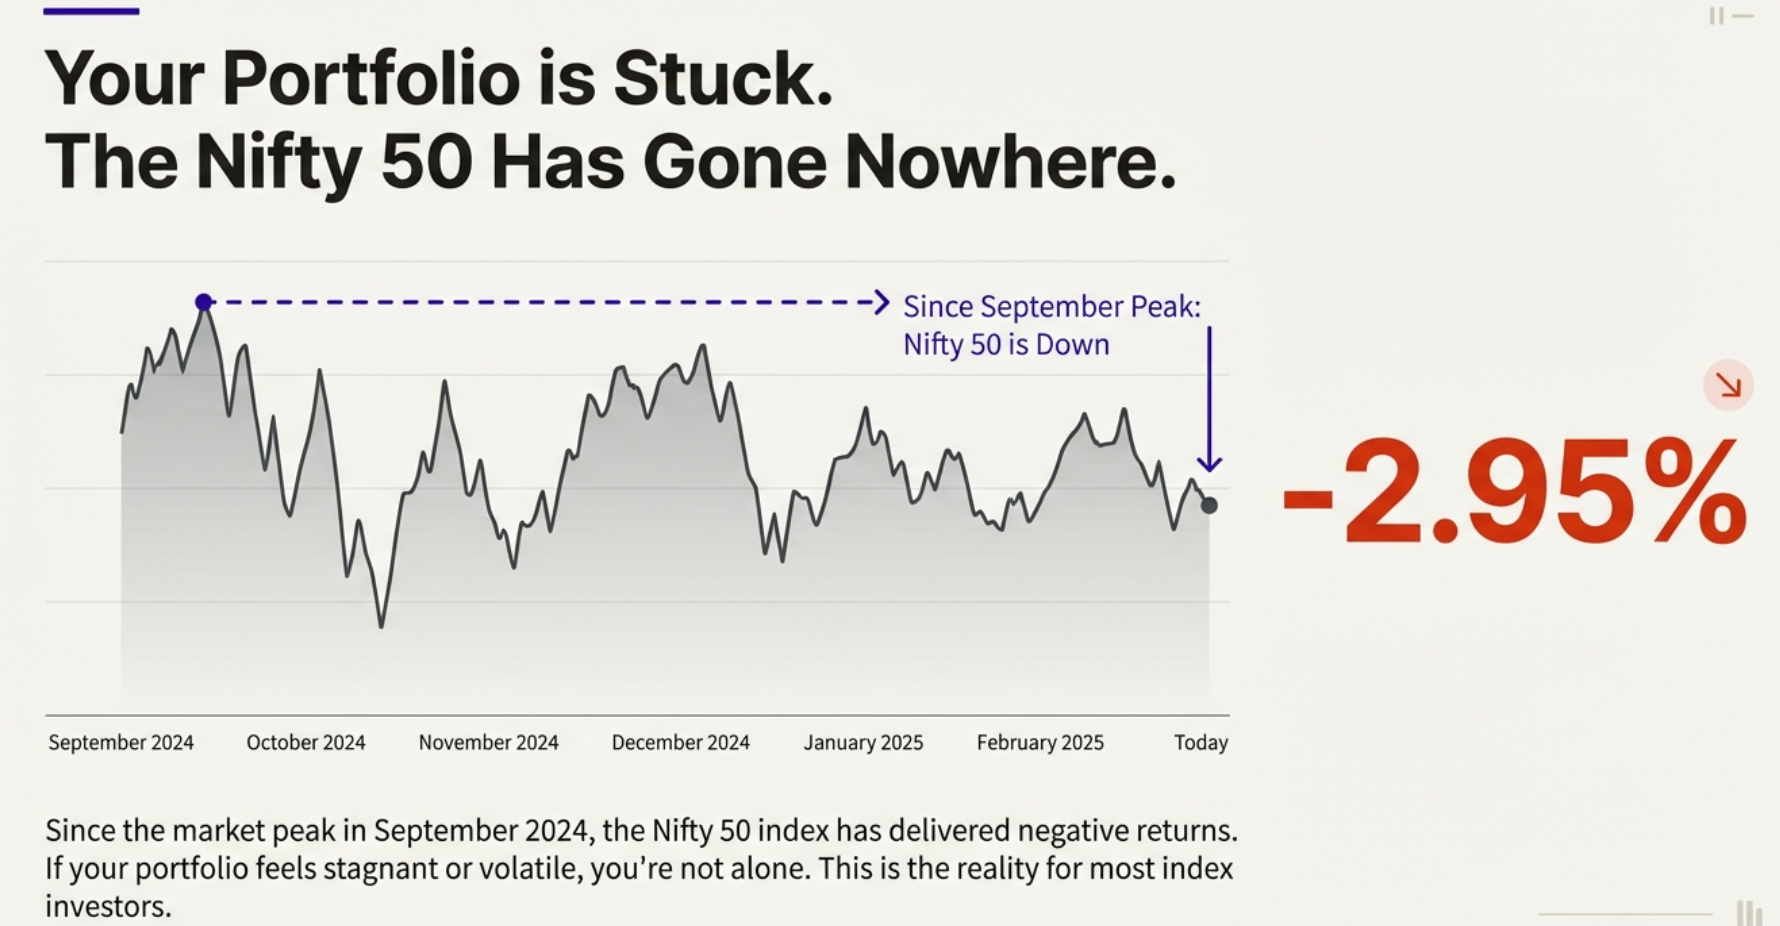
Since the market peak in September 2024, the Nifty 50 index has delivered frustrating negative returns. For investors who allocated their capital at that point, their portfolios show -2.95% returns today.
If your portfolio feels stagnant or volatile, you're experiencing what most index investors face. The market has been sideways—up one month, down the next, consolidating for weeks. It's exhausting and demoralizing.
The Index (Nifty 50)
Sept 2024 - Present
Momentum Stock (Bharti Airtel)
Same Period
🚀 But While the Index Slept, Certain Stocks Soared
The secret isn't about timing the market; it's about finding stocks with their own powerful momentum, independent of the index. These aren't obscure small-caps; Bharti Airtel is a Nifty 50 giant itself.
This is the power of momentum trading. While traditional investors focus on "value" and "buying the dip," momentum traders understand a fundamental truth: stocks in motion tend to stay in motion.
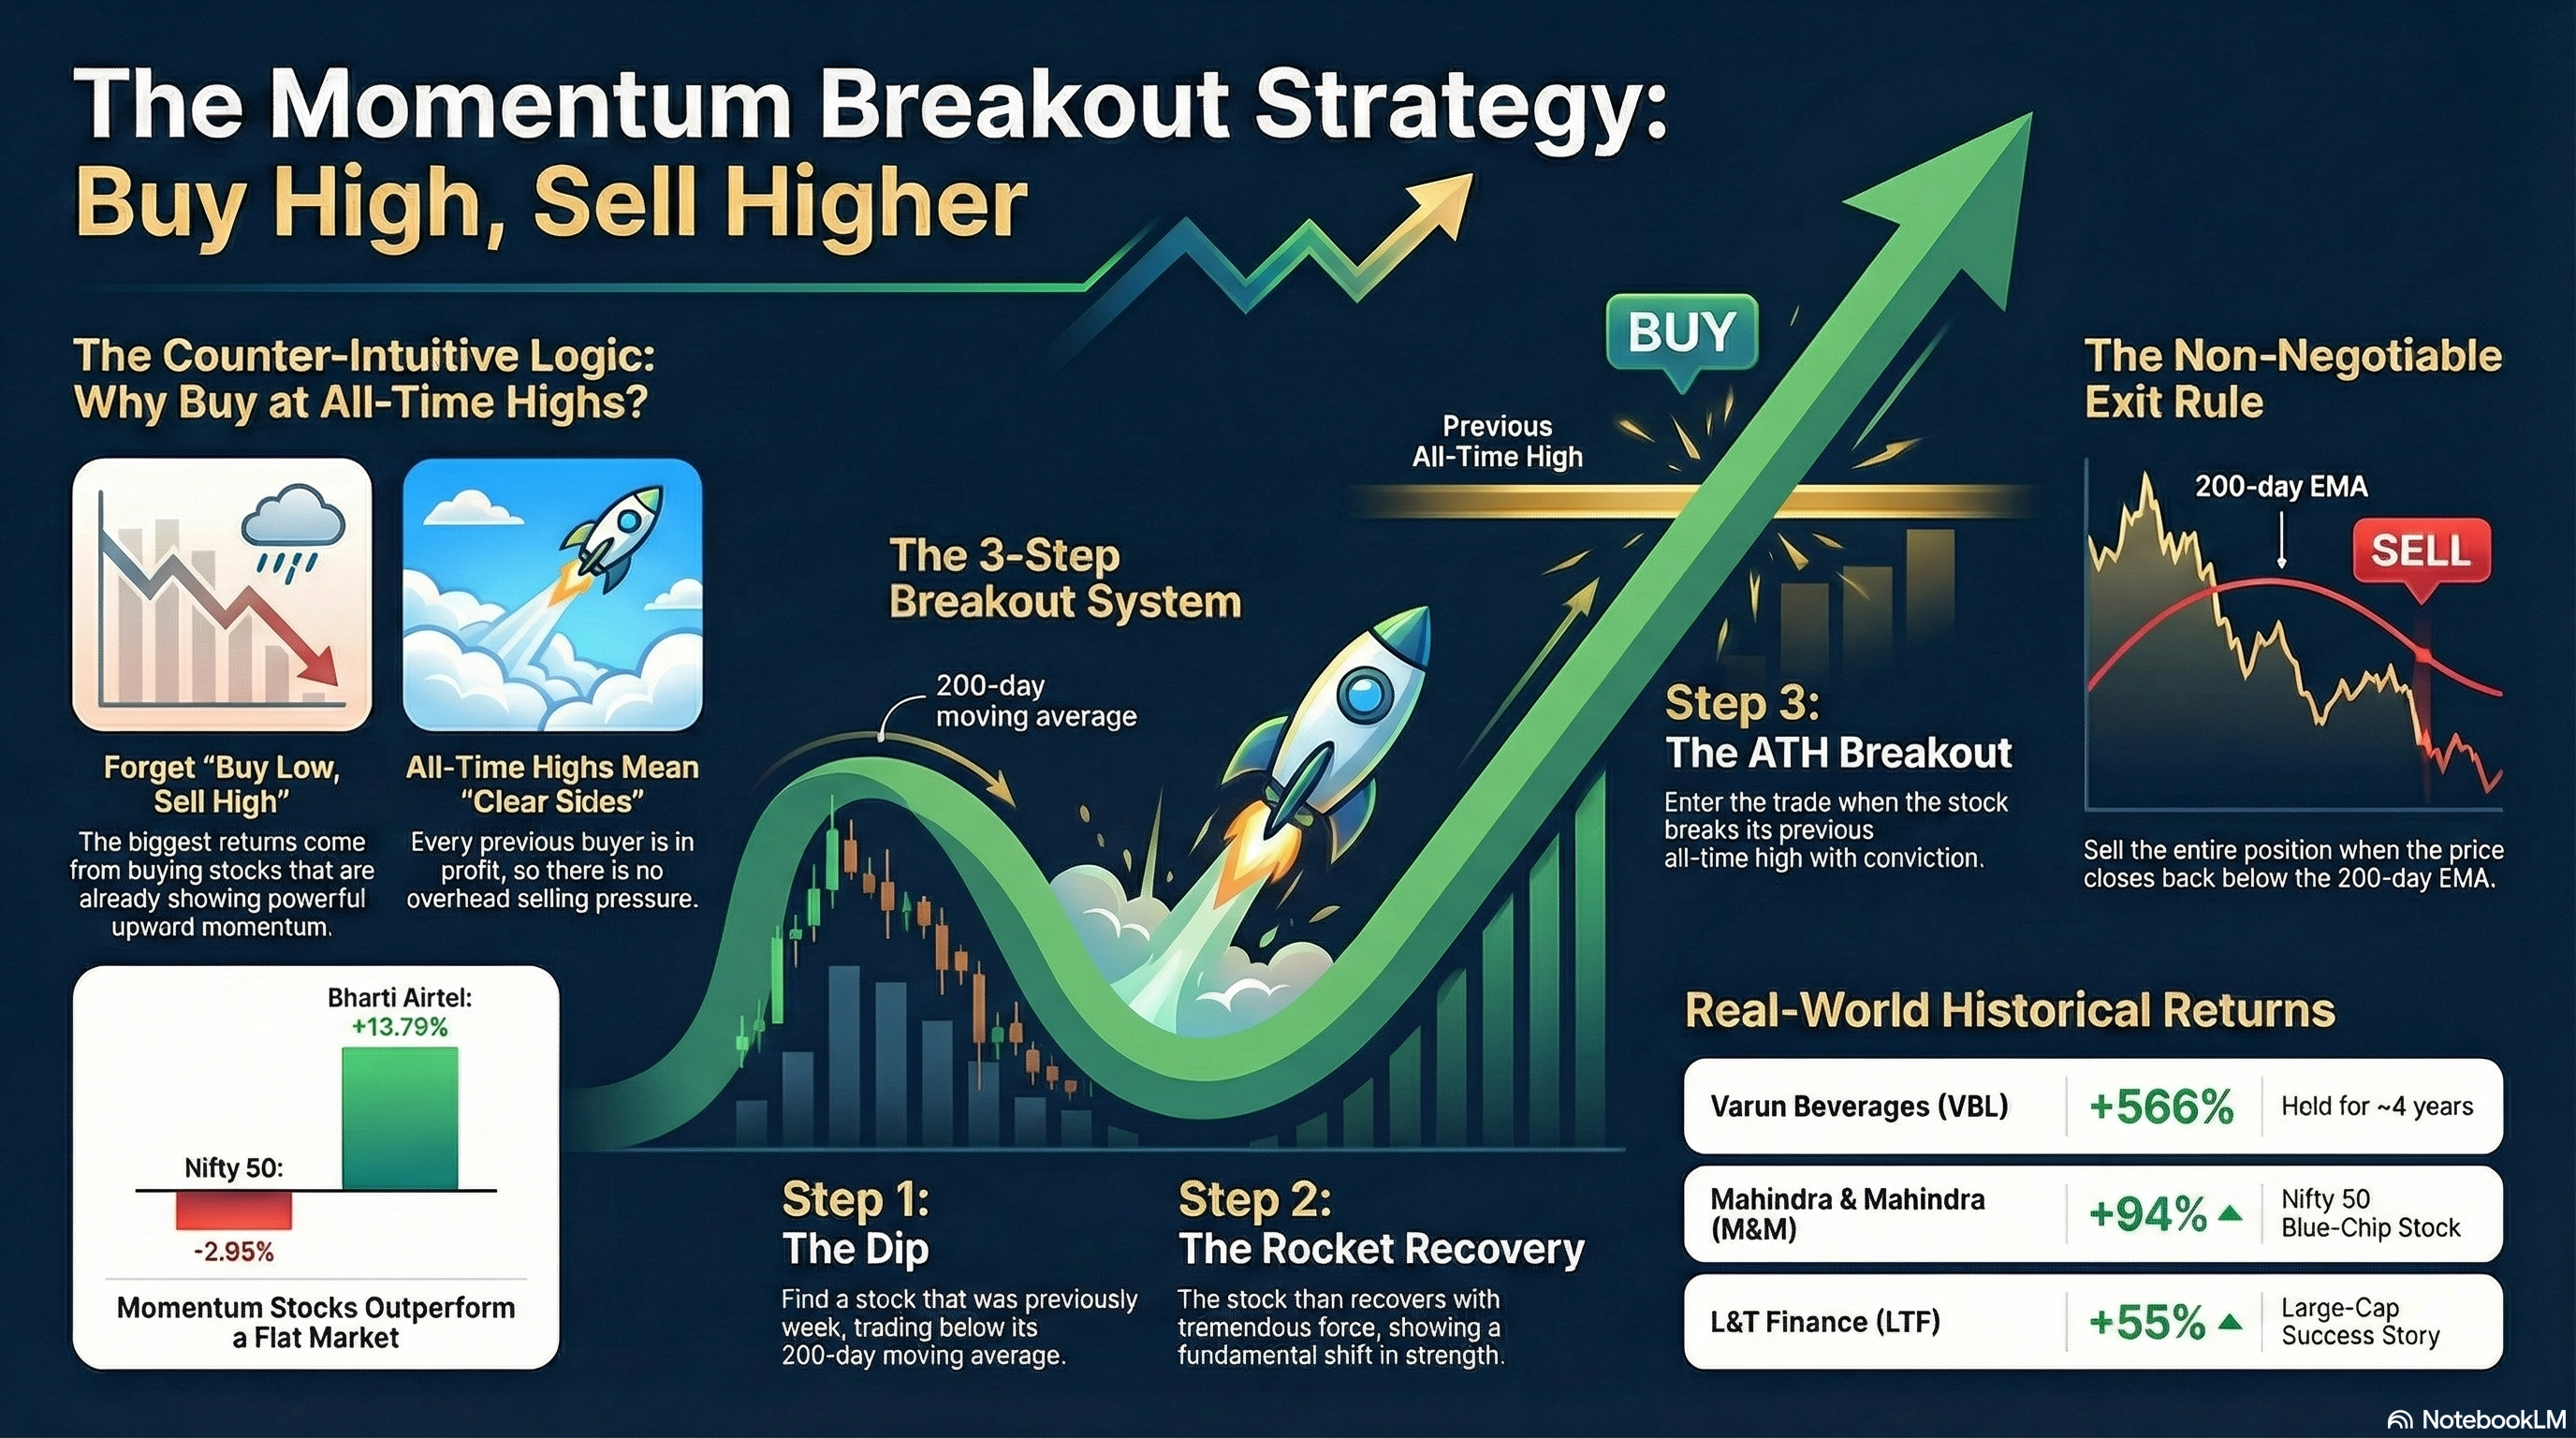
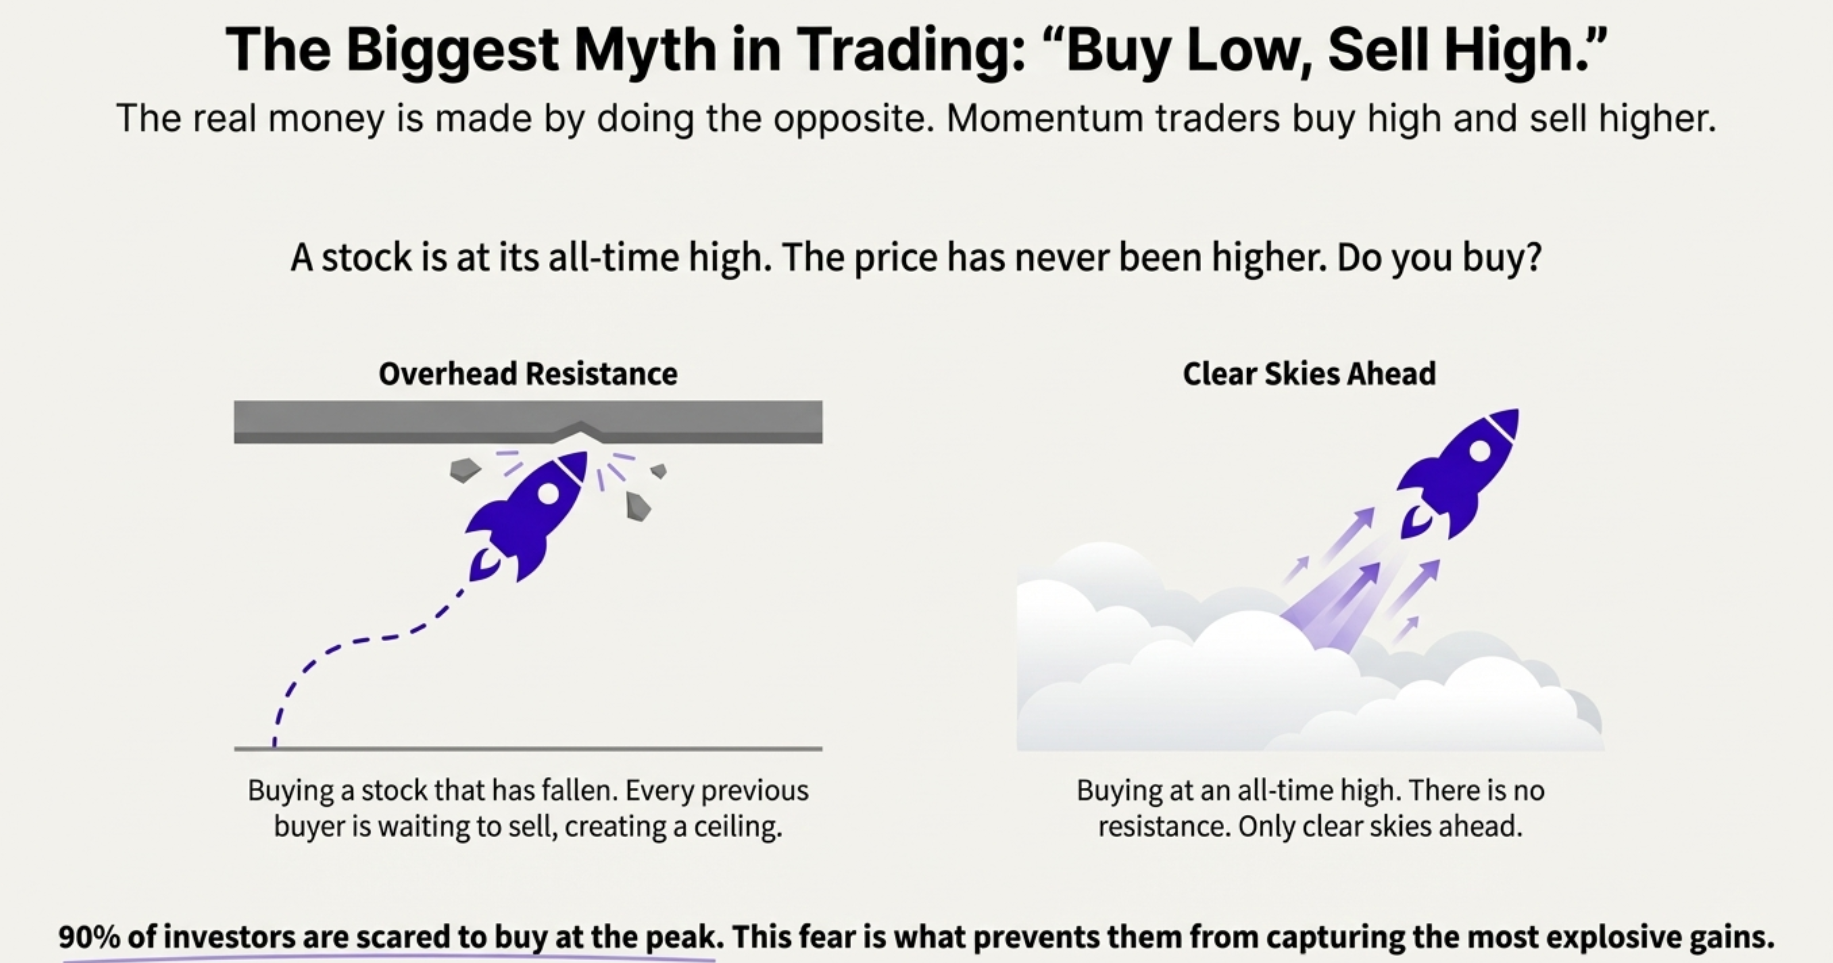
The Biggest Myth in Indian Trading: "Buy Low, Sell High"
Traditional wisdom teaches us to "buy low, sell high." But the real money is made by doing the opposite. Momentum traders buy high and sell even higher.
Picture this: A stock is at its all-time high. The price has never been higher in its entire history. Do you buy it?
Most investors instinctively say no. They think: "This stock is too expensive. It's at the peak. It must come down." But this fear is exactly what prevents 90% of investors from capturing explosive gains.
"Bhav Bhagwan Che - Price is King. When a stock is in momentum, it will continue to go up. It can go up for years—not weeks, not months, but years. This is what separates momentum stocks from average stocks."
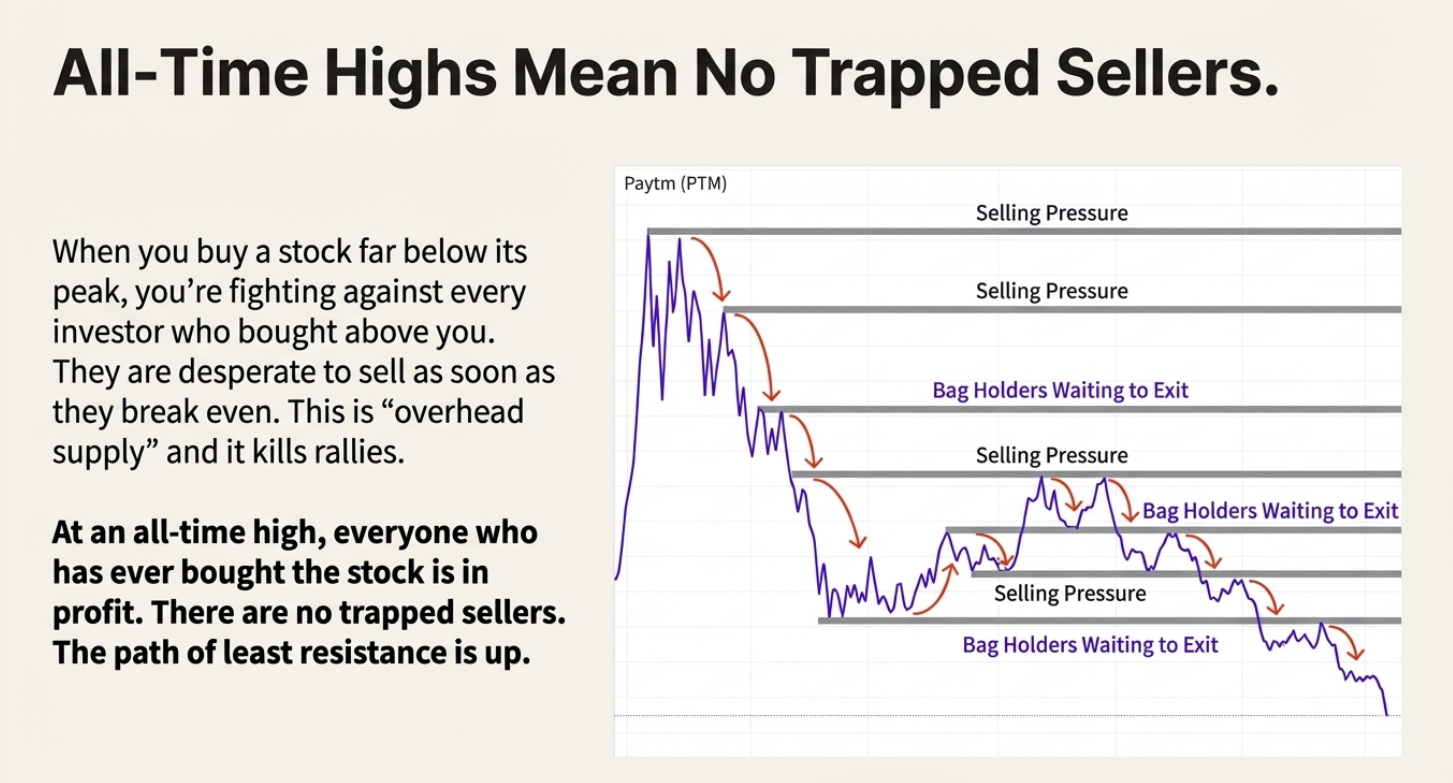
All-Time Highs Mean No Trapped Sellers:
| Factor | Traditional View: "Buy Low" | Momentum View: "Buy at ATH" |
|---|---|---|
| What You're Buying | A falling knife. Every previous buyer is underwater and waiting to sell. | A rocket ship. Everyone who ever bought the stock is in profit. |
| Overhead Resistance | Heavy selling pressure from bag holders at every level | Zero. There's no one above you to sell into strength. |
| Market Psychology | Fighting against desperate, trapped sellers | Riding with confident, profitable buyers |
| Path Forward | Must battle through multiple resistance zones | Clear skies ahead—path of least resistance is UP |
⚠️ The Critical Realization
If you're unwilling to ever buy at an all-time high, you can never capture stocks that deliver 100%, 200%, or 500%+ returns. Because for a stock to produce massive returns, it must, by definition, continuously make new all-time highs throughout its journey.
The Momentum Breakout: A 3-Step System for Explosive Stocks
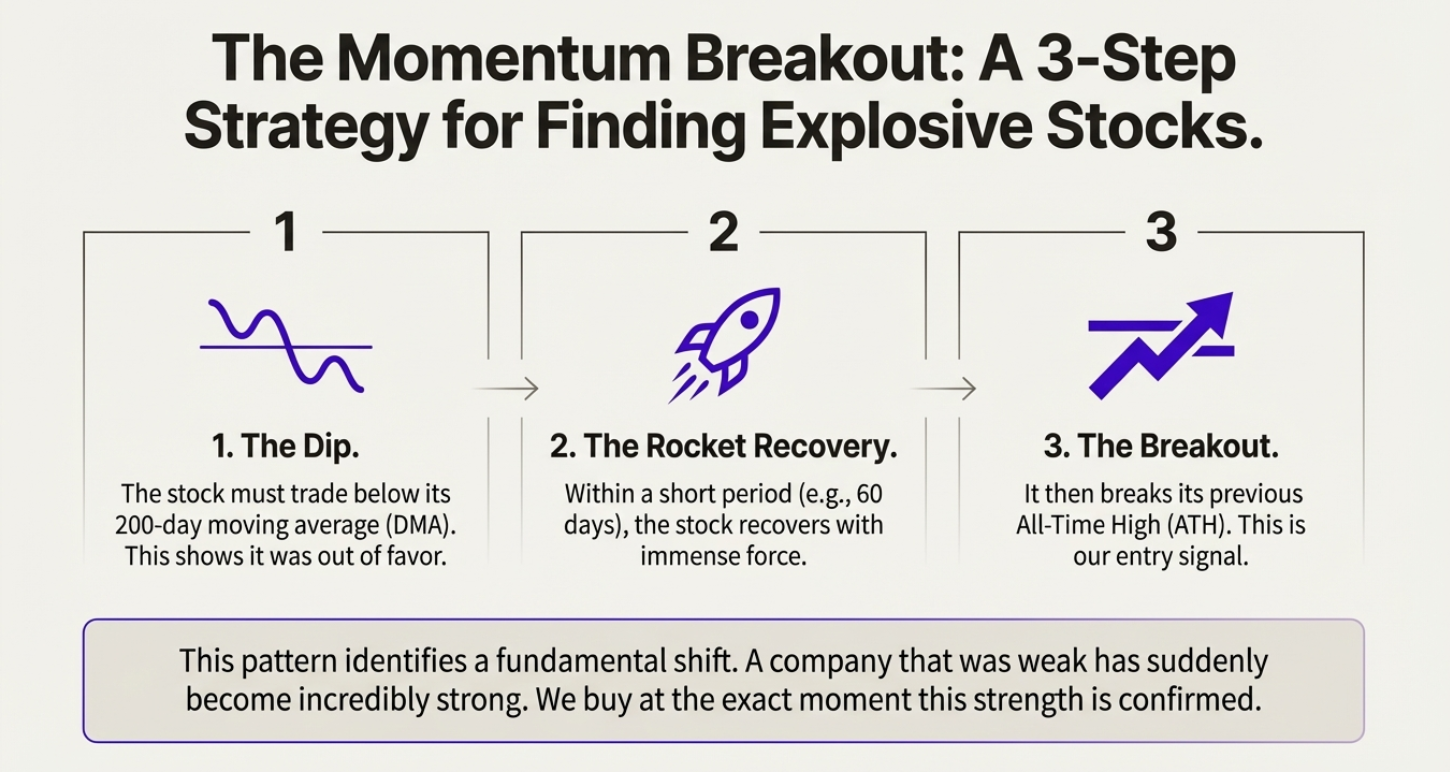
🔻 The Dip
Stock trades below its 200-day moving average, showing it was previously out of favor and weak.
🚀 The Rocket Recovery
Within a relatively short period, the stock recovers with tremendous force and power.
💥 The ATH Breakout
It breaks its previous All-Time High with conviction. This is our entry signal.
🎯 Why This Pattern Works Like Magic
This pattern identifies a fundamental transformation. A company that was previously weak has suddenly become incredibly strong. We enter at the exact moment this strength is confirmed by the market.
Your Only Indicator: The 200-Day EMA
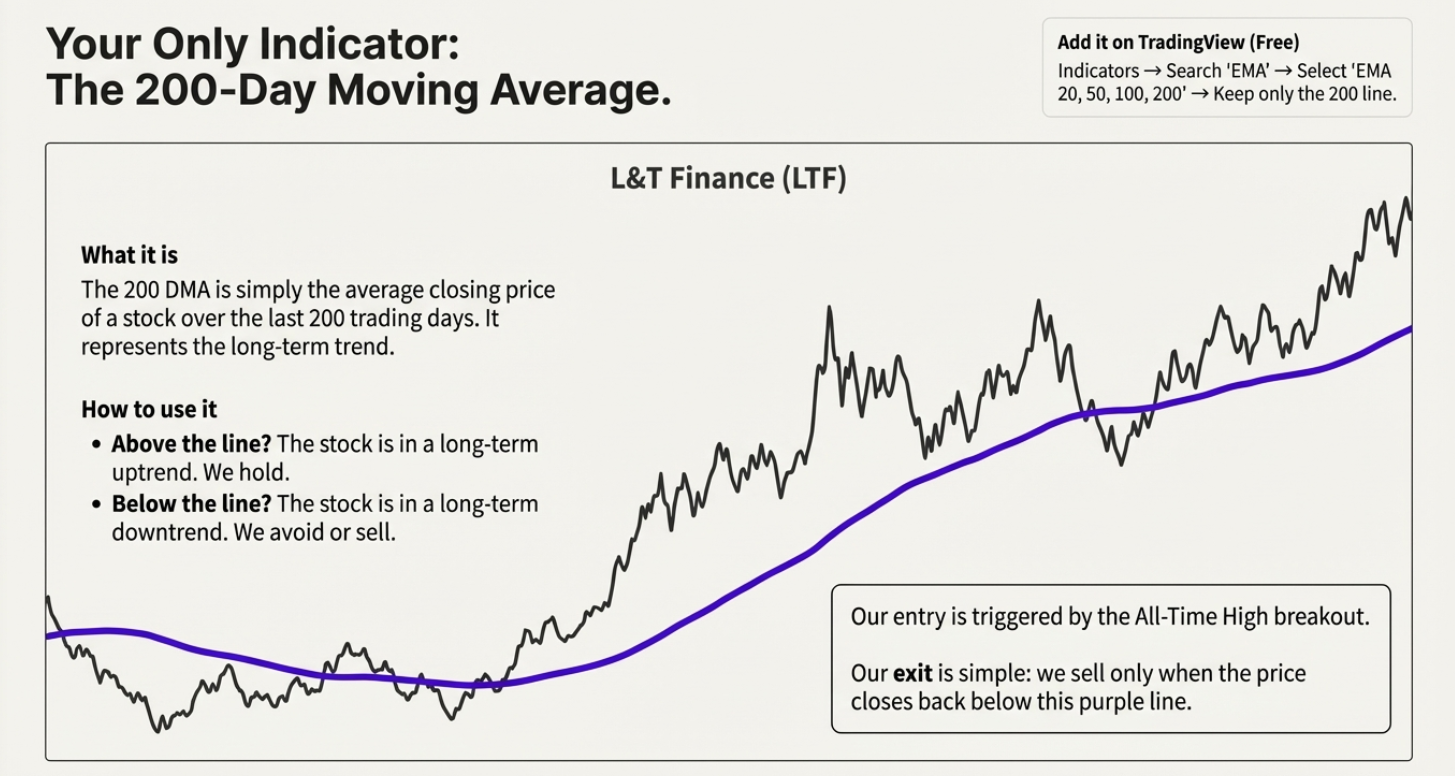
The 200-day Exponential Moving Average is simply the weighted average closing price of a stock over the last 200 trading days. It represents the long-term trend and sentiment.
💡 How to Use the 200-Day EMA
Stock above the line? Long-term uptrend. We hold with confidence.
Stock below the line? Long-term downtrend. We avoid or exit.
Our entry trigger: All-Time High breakout while stock is recovering toward or crossing above 200-day EMA.
Our exit is simple: We sell only when the price closes back below the 200-day EMA line.
Case Study: How This Simple System Delivered +566% Returns
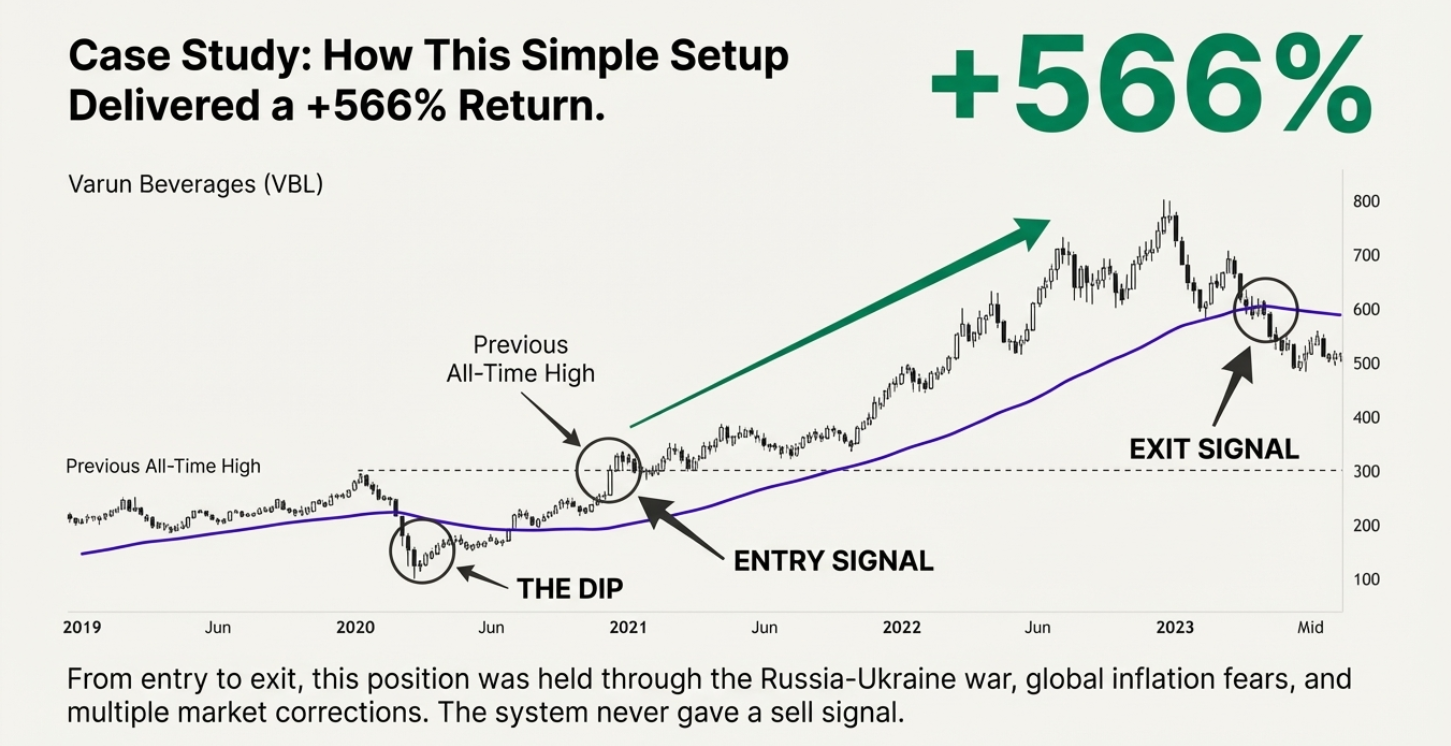
Varun Beverages (VBL)
Entry to Exit: ~4 Years | Held Through Russia-Ukraine War, Global Inflation, Multiple Market Corrections
From entry to exit, this position weathered the Russia-Ukraine war, global inflation crisis, and multiple market corrections. The 200-day EMA system never gave a false exit signal during the entire 4-year run.
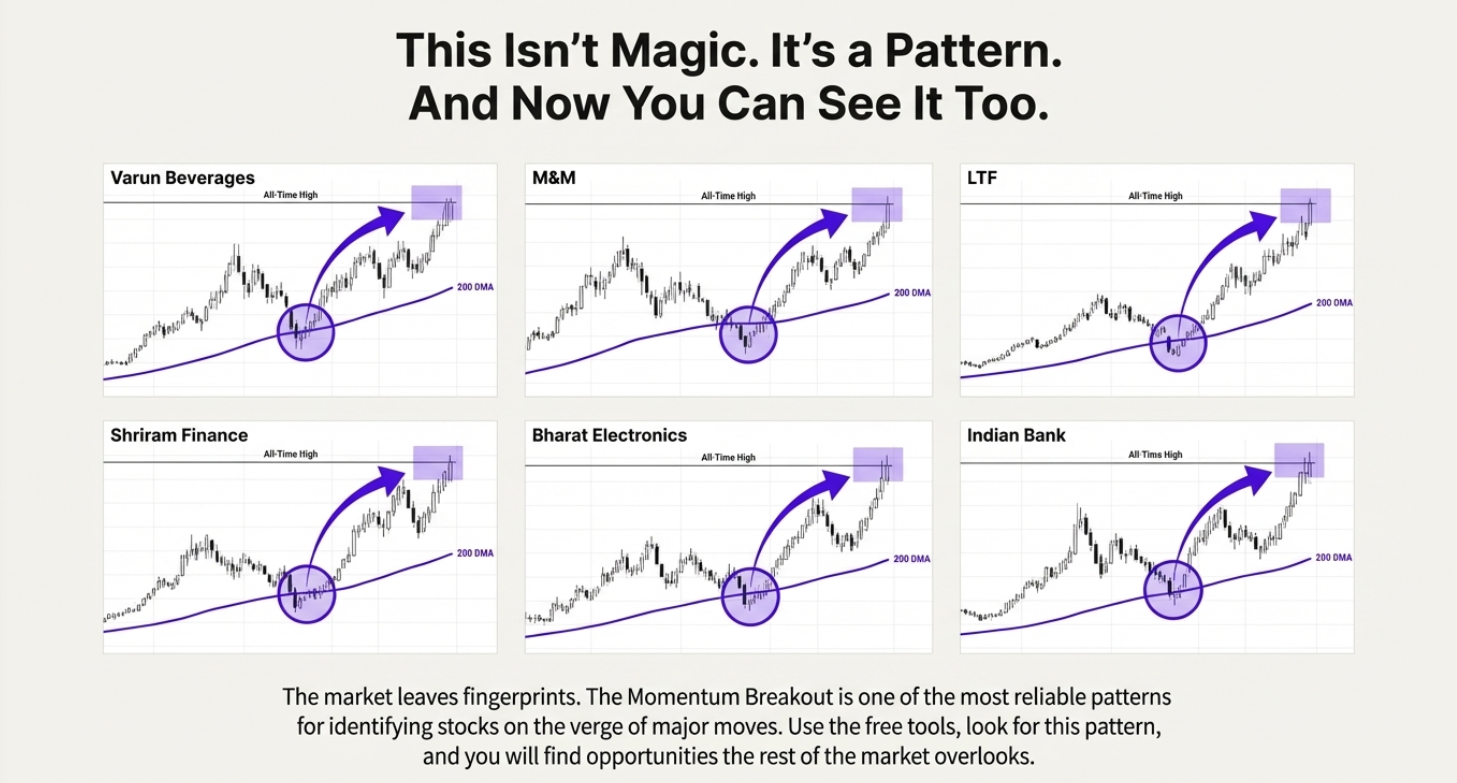
More Large-Cap Success Stories:
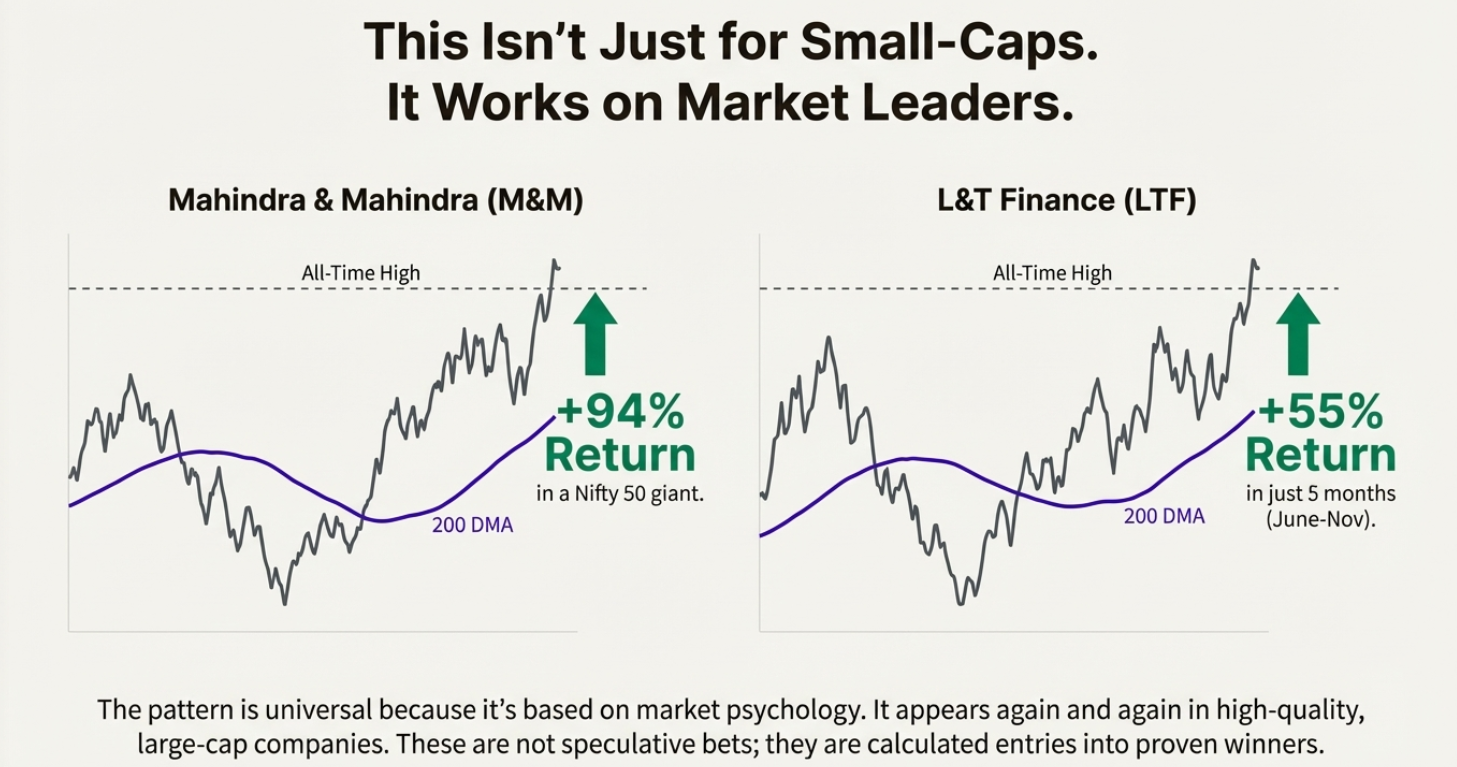
Mahindra & Mahindra (M&M)
Nifty 50 Blue-Chip Giant
L&T Finance (LTF)
Same Period Performance
Multiple Large-Caps
Consistent pattern across market caps
💡 Why This Works on Large-Caps Too
This isn't just for risky small-caps. The pattern appears consistently in market leaders and Nifty 50 companies. The psychology is universal—when strong companies break to new highs, they often continue much higher. These are calculated entries into proven winners, not speculative bets.
Your Free Implementation Toolkit
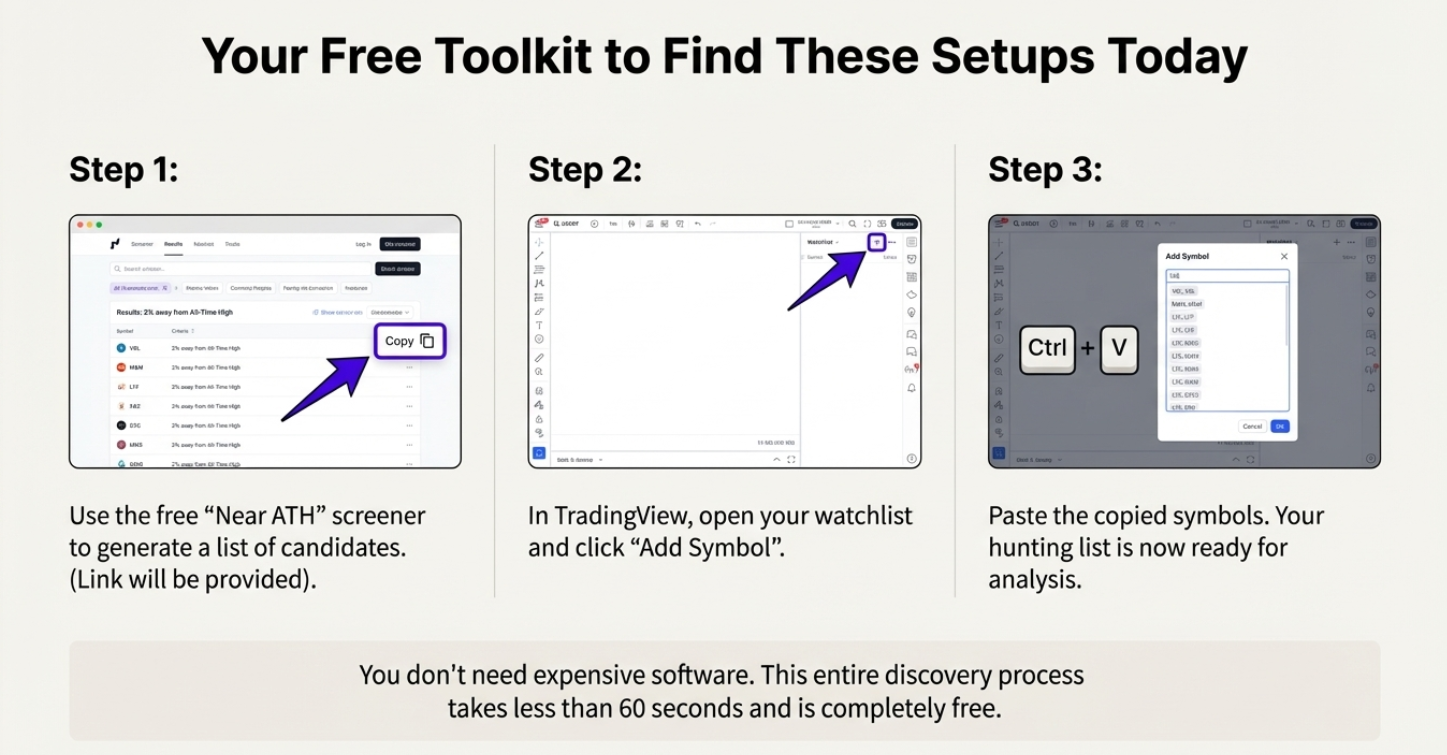
Step 1: Identify Potential Targets
ATH Breakout Scanner: Use free "Near ATH" screeners to generate candidate lists
Stage 2 Trend Filter: Cross-reference with Stage 2 screeners for momentum confirmation
Recent IPO Tracker: Monitor new listings for post-listing ATH breakout setups
These free tools handle 80% of the screening work automatically.
Step 2: Analyze Chart Patterns
TradingView Free: Professional charting platform with 200-day EMA indicator
Pattern Recognition: Look for the 3-step sequence: Dip → Recovery → ATH Breakout
Volume Confirmation: Ensure breakouts occur with above-average trading volume
Complete chart analysis takes under 60 seconds per stock once you know what to look for.
Step 3: Build Your Momentum Watchlist
- Copy stock symbols from your filtered screener results
- In TradingView, open your watchlist and click "Add Symbol"
- Paste the symbols (Ctrl+V) to populate your tracking list
- Set up alerts for ATH breakouts on your top candidates
- Monitor weekly for new setups and evolving patterns
Current Market Opportunities: Live Examples
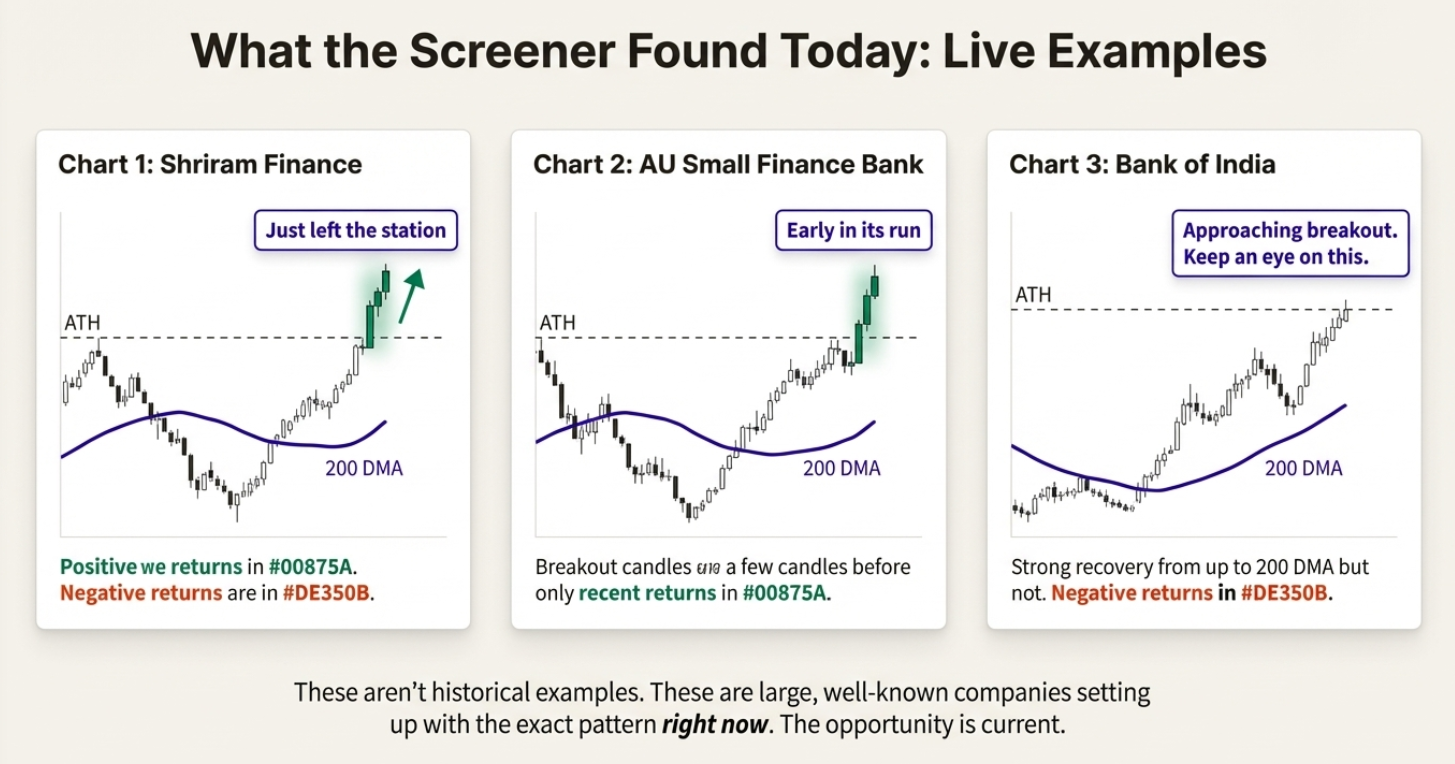
These aren't historical backtests. These are live examples of established companies setting up with our exact pattern right now. The opportunity exists in real-time.
Recent Stage 2 Breakout: Shriram Finance
Status: Recently confirmed breakout
Pattern: Dipped below 200-day EMA → Rapid recovery → ATH breakout confirmed with volume
Analysis: Already delivering positive returns post-breakout. Classic Stage 2 momentum in progress.
Early Stage Setup: AU Small Finance Bank
Status: Early in potential momentum run
Pattern: Recent breakout candles showing initial momentum above key resistance
Analysis: Strong recovery from 200-day EMA with room to run in Stage 2 advance.
Approaching Setup: Bank of India
Status: Watch list candidate - approaching breakout
Pattern: Strong recovery from below 200-day EMA, building toward ATH resistance
Analysis: Showing "supreme momentum" characteristics, not yet confirmed but worth monitoring closely.
⚠️ Important: Educational Examples Only
These examples demonstrate pattern recognition in action. Markets change rapidly, and by the time you read this, conditions may be different. Always conduct your own current analysis before making any investment decisions. The goal is teaching you to recognize these setups independently.
Advanced Technique: Supercharge Results with Stage Analysis
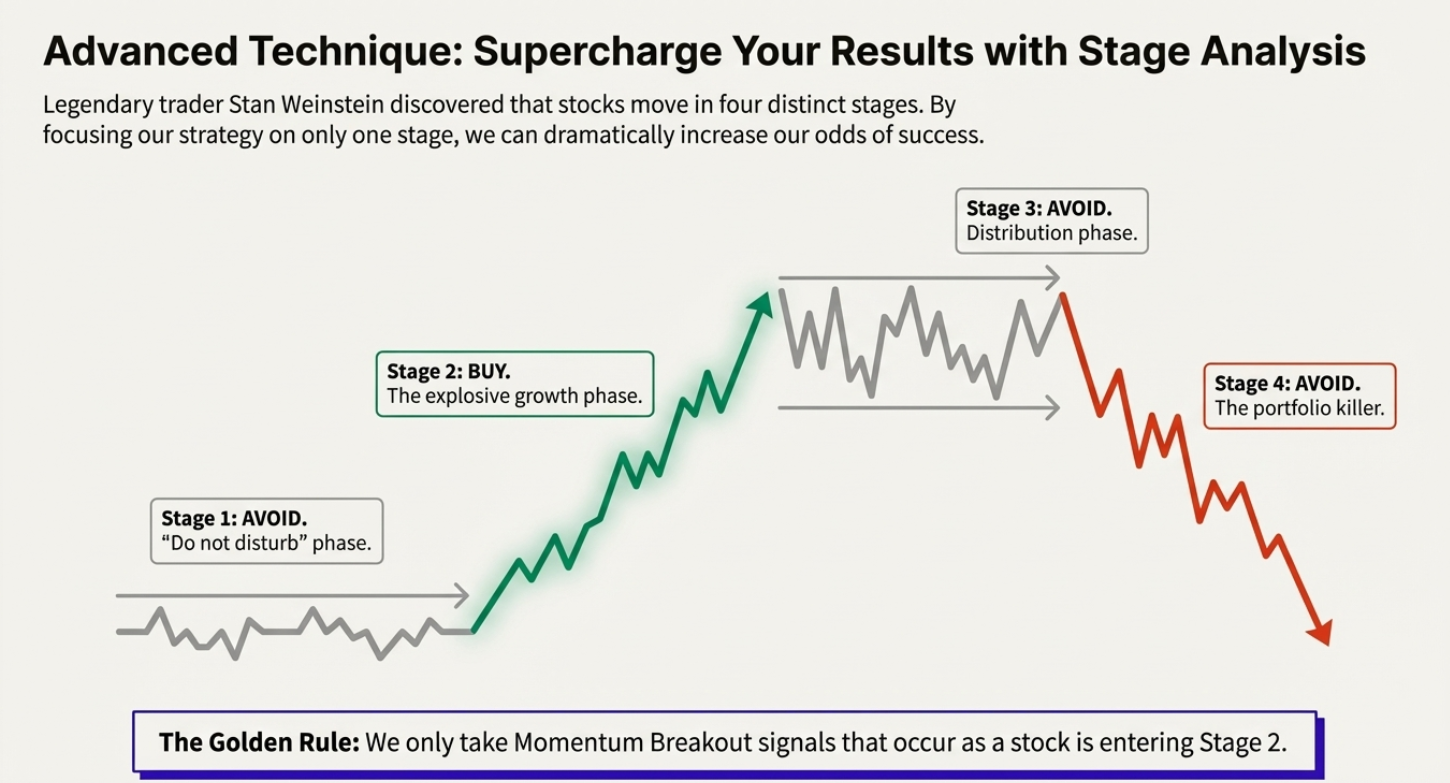
Legendary trader Stan Weinstein discovered that every stock moves through four distinct stages. By focusing our momentum strategy on only one stage, we dramatically increase our success rate.
Stage 1: AVOID
Basing/sleeping phase. Stock moves sideways with no clear direction. "Do not disturb."
Stage 2: BUY ✅
The advancing phase. Clear uptrend begins, delivering strong returns to patient holders.
Stage 3: AVOID
Distribution/topping phase. Stock stops advancing and moves sideways after major run-up.
Stage 4: AVOID
The declining phase. Clear downtrend that destroys portfolio value.
🎯 The Golden Filter Rule
We only take Momentum Breakout signals when a stock is entering or confirming Stage 2. This is where the magic happens.
The Ultimate Combination: Stage 2 + ATH Breakout
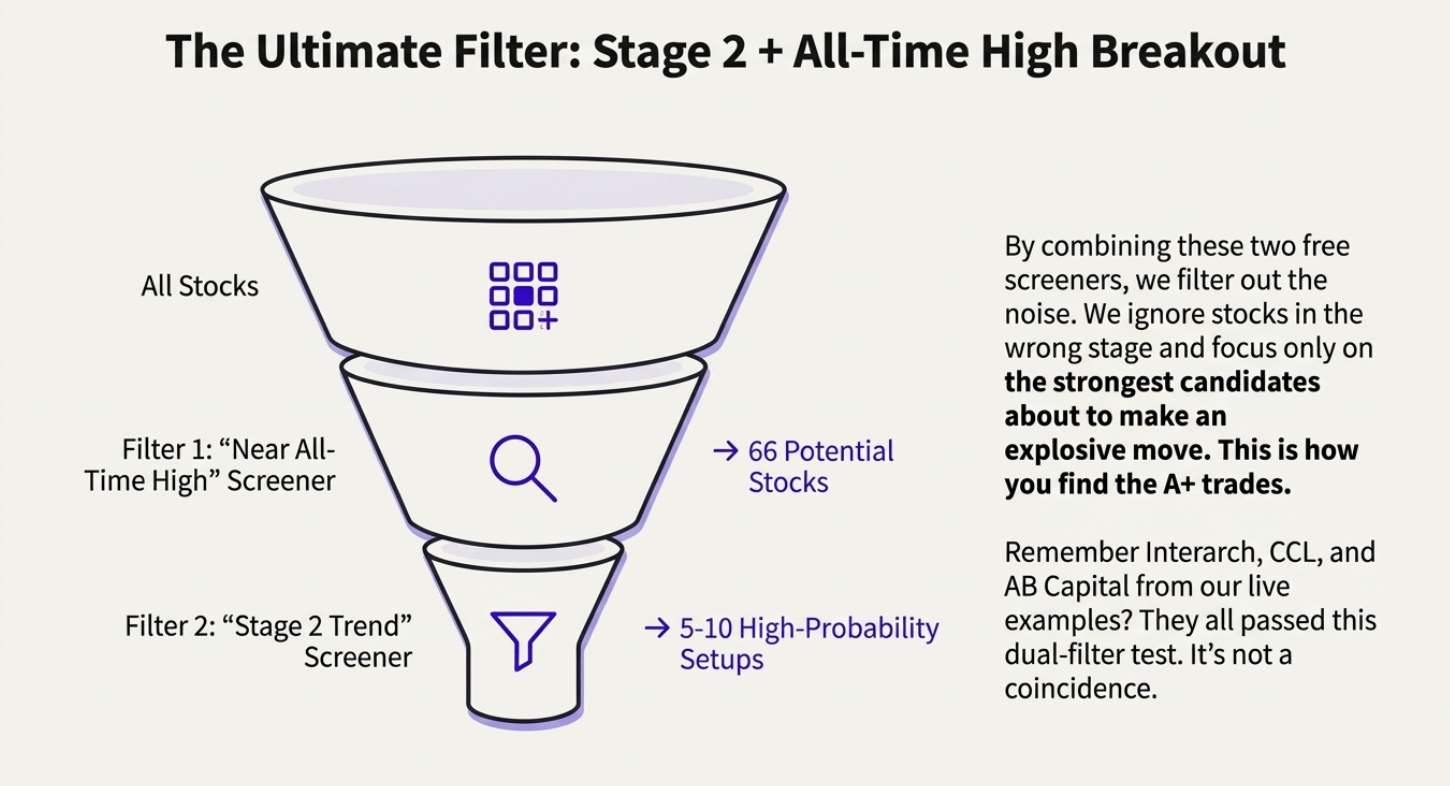
By combining free Stage 2 screeners with ATH breakout filters, we eliminate noise and focus only on the strongest candidates preparing for explosive moves. This is how you find A+ setups.
| Filter Step | Purpose | Typical Results |
|---|---|---|
| Filter 1 | "Near All-Time High" Screener | ~60-80 Potential Candidates |
| Filter 2 | "Stage 2 Trend" Verification | 5-15 High-Probability Setups |
| Manual Review | Chart pattern confirmation | 2-5 A+ Opportunities |
🎁 Bonus Strategy: The IPO Breakout Method
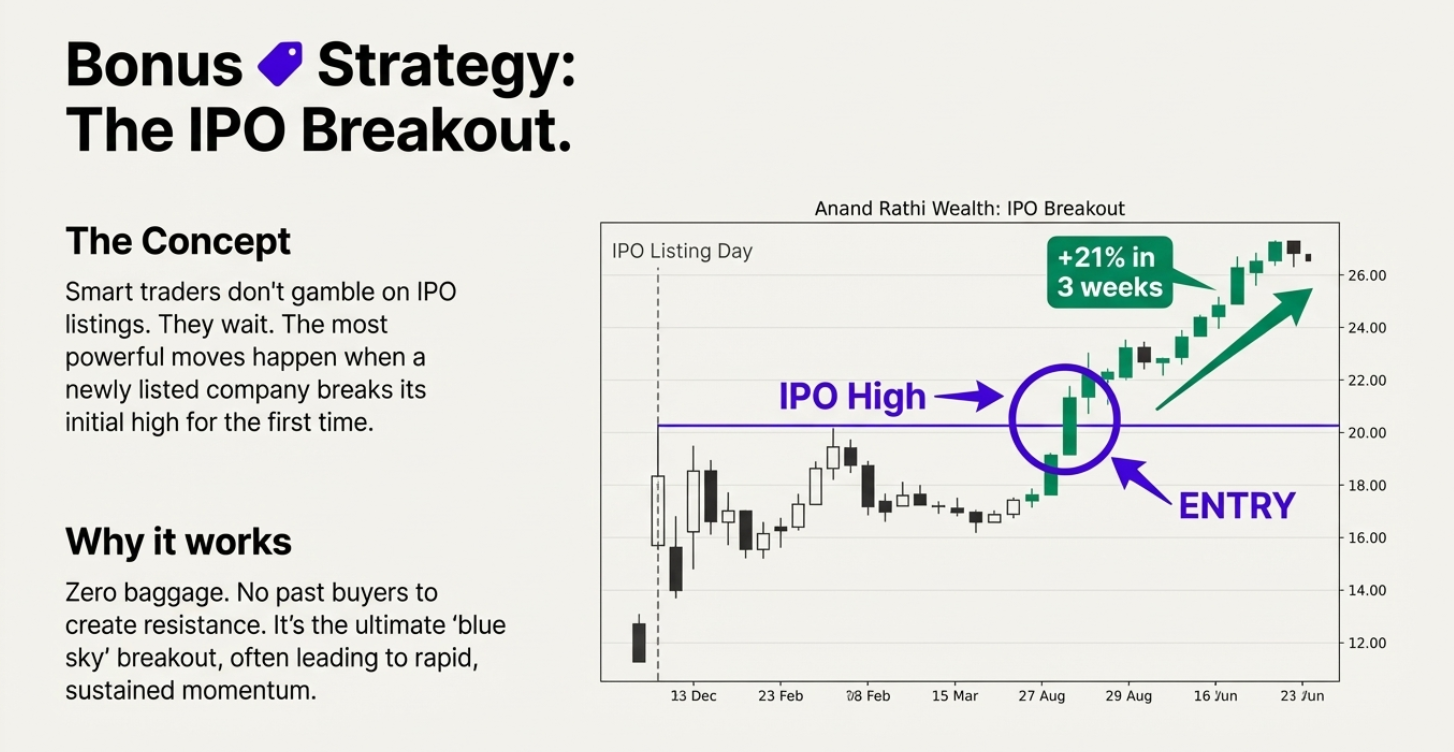
The Core Concept
Smart momentum traders don't gamble on IPO listings. Instead, they wait patiently. The most explosive moves often happen when a newly listed company breaks its initial high for the first time after consolidation.
🚀 Zero Baggage = Zero Resistance
Unlike established companies with historical resistance levels, IPO breakouts offer the ultimate "blue sky" scenario. No trapped sellers above, no overhead supply, just pure momentum potential.
Anand Rathi Wealth
In just 3 weeks after IPO high breakout
Tata Technologies
In just 2 weeks after confirmation
Multiple Recent IPOs
Average gains within 1-3 months
The Complete IPO Breakout Process:
- Don't apply for IPO allotment (low probability, high uncertainty)
- Let the IPO list and settle - most decline or consolidate initially
- Monitor for Stage 2 setup - recovery above 200-day EMA if available
- Wait for ATH breakout confirmation with volume and momentum
- Enter with 100% "allotment" guarantee via open market purchase
- Exit on 200-day EMA breakdown or loss of momentum characteristics
Portfolio Management & Risk Control

Position Sizing for Momentum Trading
The recommended portfolio approach is holding 7-10 momentum trades simultaneously. This provides adequate diversification without diluting the impact of your best performers.
⚠️ The Non-Negotiable Exit Rule
Exit the entire position when the stock's price closes below the 200-day moving average line. No exceptions, no hoping, no waiting for "just one more day." This rule protects your capital and preserves profits.
Understanding Risk vs Reward
When you enter near an ATH breakout with our system:
- Maximum risk: Distance from entry down to 200-day EMA (typically 10-20%)
- Profit potential: Unlimited—stocks can remain in Stage 2 for years
- Historical edge: No overhead resistance means momentum can persist much longer
🎯 Powerful Risk/Reward Mathematics
Historical examples show this strategy can deliver 50-500%+ returns while typically risking 10-20%. The VBL example risked one unit to make nearly six units—a 6:1 reward-to-risk ratio over the holding period.
The Pattern Is Universal - And Now You Can See It Too
While the Nifty 50 delivered -2.95% since September 2024, momentum stocks like Bharti Airtel gained +13.79% in the same period. The difference isn't luck—it's having a systematic approach to identifying stocks entering Stage 2 with confirmed ATH breakouts.
"The more simple a trading method is, the more effective it tends to be. Complexity is the enemy of execution."
You now understand the complete momentum breakout system:
- Why buying at all-time highs provides clear skies with zero overhead resistance
- How the 200-day EMA serves as both trend indicator and non-negotiable exit signal
- The three-step pattern: Dip → Rocket Recovery → ATH Breakout
- How Stage 2 analysis filters for the highest-probability setups
- Real examples delivering 55%, 94%, and 566% returns over their respective cycles
- The IPO breakout strategy for capturing explosive new listings with zero baggage
- Professional risk management and position sizing for sustainable success
🎯 Remember the Core Truth
Bhav Bhagwan Che - Price is King. When a stock enters true momentum, it can continue rising for months or even years. This phenomenon separates momentum stocks from average stocks and creates the foundation for wealth-building returns.
The market leaves clear fingerprints. This pattern appears repeatedly in high-quality companies across all sectors and market caps. You can now see these fingerprints too.
Start building your first momentum watchlist this weekend. The tools are free, the strategy is proven, and the next opportunity is forming right now.
🚀 Implement Your Momentum Strategy with Professional Tools
Use Finmagine's comprehensive analysis framework to find momentum breakout candidates:
⚡ Live Momentum Tracker Pro 🔍 Advanced Stock Screener 📊 Company Analysis 🏦 Banking Sector Focus📚 Continue Your Investment Education
Master advanced market analysis and portfolio construction:
📈 Our Research Framework 💼 Portfolio Strategy🎯 Start Your Momentum Journey Today
The tools are free, the strategy is proven, and the next momentum breakout opportunity is forming right now. Begin your systematic approach to capturing explosive stock movements.