Following along? Install the extension first
Finmagine AI Advisor — free • no account needed • Chrome, Edge, Brave
You're Paying for Active Funds… But Getting an Index 🤯
If you invested in a top-performing active mutual fund five years ago, there is a high statistical likelihood that today you are paying a 1%–2% annual fee for a fund that is quietly copying the index. This is called closet indexing — and until recently, it was almost impossible for a retail investor to detect without spending three days buried in a spreadsheet.
The financial industry has thrived on an asymmetry: fund houses have access to every data point, and retail investors drown in numbers without the tools to synthesise them. You have the data. You simply do not have the time or the mathematical stamina to cross-reference 10 years of trailing returns, compare them against the correct benchmark (not the one the fund cherry-picked), compute the compounded fee drag, and assess whether the top holdings reveal a manager who is genuinely active or just hugging the Nifty Fifty.
That asymmetry is exactly what the Finmagine AI Advisor v2.14.0 is designed to close. A panel appears on every Value Research Online fund page — automatically, in under 4 seconds — and assembles a precision-structured prompt that hands all of that complexity to an AI analyst in one click. The era of data scarcity ended years ago. The era of instant institutional-grade synthesis has just begun.
📚 Multimedia Learning Hub
Watch, listen, explore, and test your knowledge — complete learning path for the VRO MF Analysis feature
What You Will Learn
This article introduces the Finmagine AI Advisor v2.14.0 mutual fund analysis feature — the first capability outside Indian and US stocks. A panel appears automatically on every Value Research Online fund page, offering three analysis templates. This guide covers how the panel works, what each template produces, and — most importantly — which one to reach for in each situation.
Topics covered:
- The closet indexing problem: Why active funds secretly track the index — and how to expose it
- How the panel activates: No setup, no click — it appears within 4 seconds of opening any VRO fund page
- What data it reads: Fund metadata, all 8 trailing return periods, top 10 holdings, asset allocation
- Deep Analysis: 7-dimension fund audit — each dimension explained with worked examples
- Active vs Index: Net alpha after fees vs the best passive alternative; the TRI vs PRI benchmark trap
- Portfolio Fit: A portfolio construction assessment using your own context
- The decision tree: Which template to open for any given question
- AI platform guidance: Which AI to paste the prompt into — and what to do if it gives you brochure-speak
Watch: You're Paying for Active Funds… But Getting an Index
This video breaks down closet indexing, why it is so hard for retail investors to detect, and how the Finmagine AI Advisor exposes it in seconds.
Key topics: What closet indexing really is · Why fund size (AUM) destroys active performance · How to detect index-hugging behaviour with AI · Stop paying premium fees for passive returns.
What Is the VRO MF Analysis Feature?
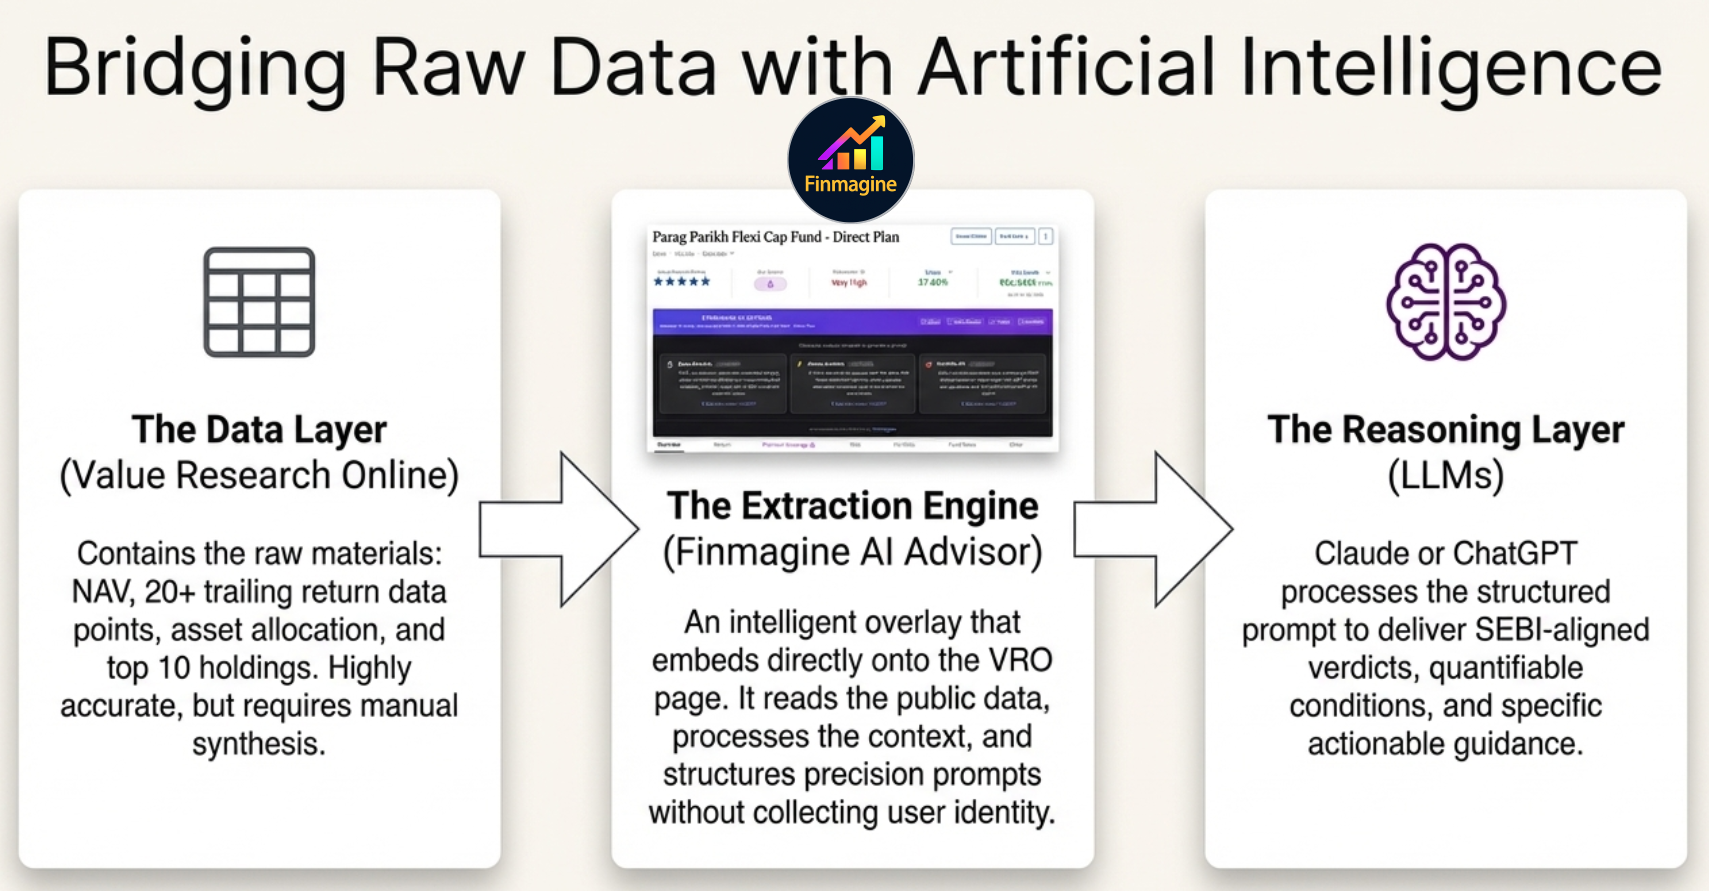
The three-layer architecture: VRO provides the raw data — Finmagine extracts and structures it — Claude or ChatGPT provides the reasoning.
Finmagine AI Advisor v2.14.0 adds mutual fund analysis on Value Research Online — the extension's first capability outside stocks. Open any fund detail page on valueresearchonline.com and a Finmagine panel appears within 3–4 seconds, embedded directly on the page. No setup. No button. No configuration.
The panel reads the fund's public data — trailing returns across 8 periods, benchmark comparison, category rank, expense ratio, AUM, fund manager, top 10 holdings, and asset allocation — and assembles one of three precision-structured prompts. You select your template, copy the prompt, and paste it into your AI of choice.
Zero-Click Activation: How It Works
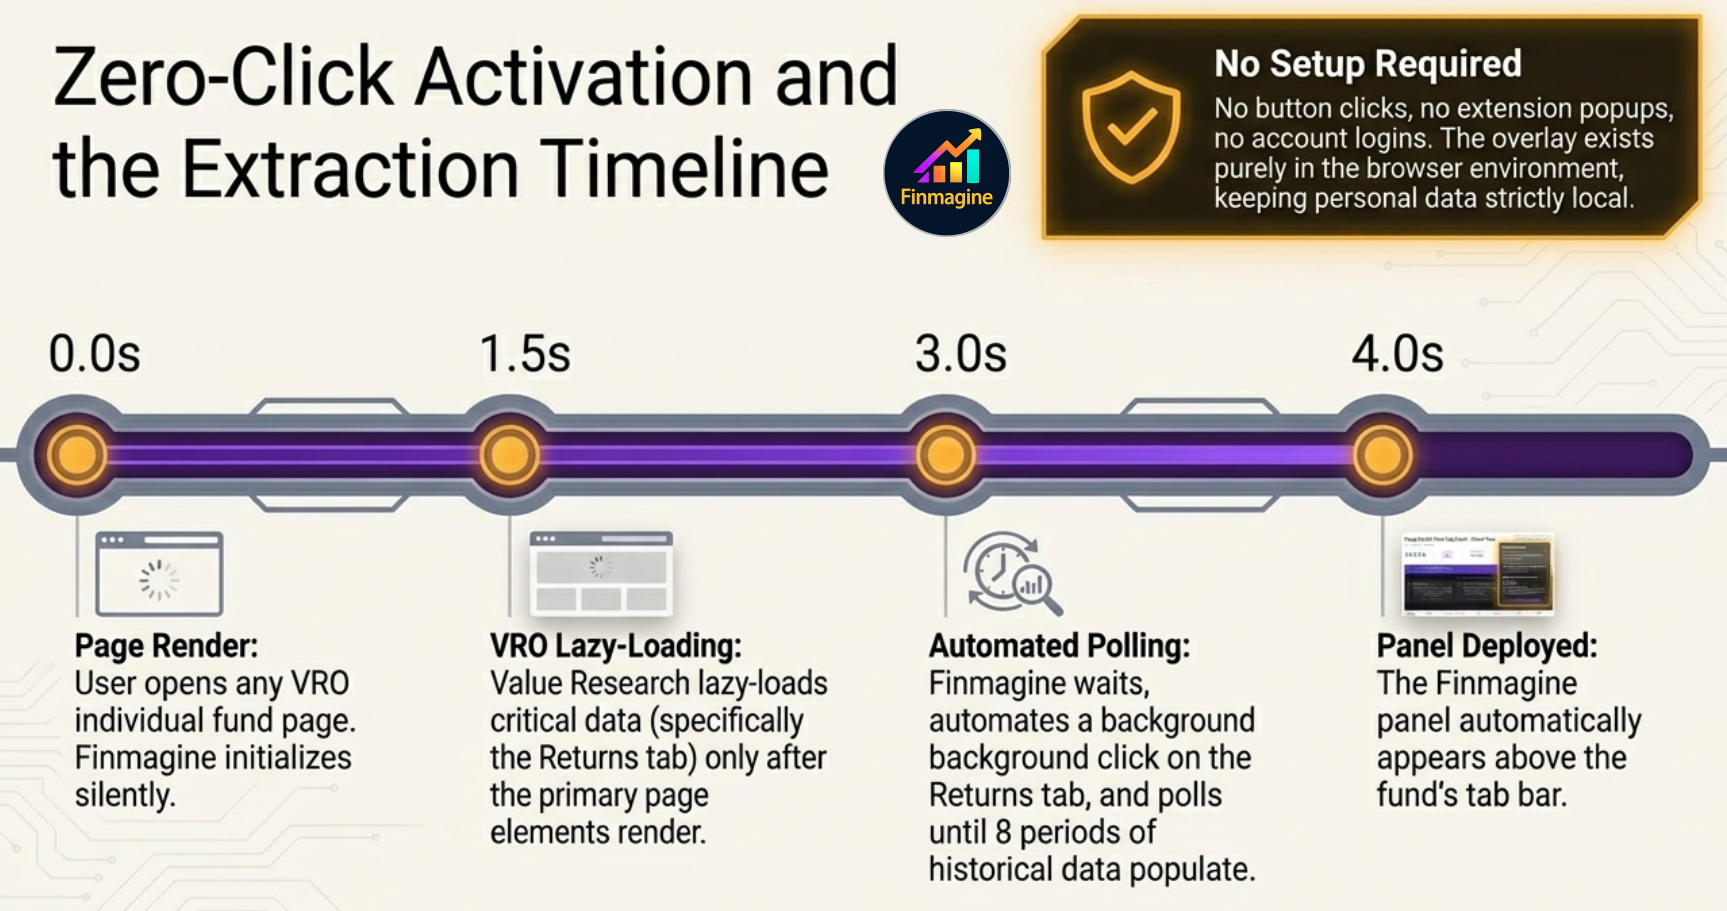
The panel does not activate immediately — it waits for VRO to finish lazy-loading the returns data before assembling the prompt.
The 3–4 second delay before the panel appears is not a loading lag — it is deliberate engineering. Value Research Online uses lazy loading: the visual shell of the page renders first, while the dense historical performance data (particularly the Returns tab) is fetched in the background. If the panel activated at second zero, it would read empty tables.
During those 4 seconds, the panel executes a hidden automated click on the Returns tab, monitors the DOM, and waits for a positive confirmation that all 8 return periods have populated. Only then does it appear. Think of it as a sous chef who comes into your kitchen, precisely preps every ingredient, measures all the spices, and lays them out on your counter — then walks out without ever asking for your name or looking in your pantry. You are left with everything perfectly ready. You decide where to take it.
How to Access It
- Install Finmagine AI Advisor from the Chrome Web Store (v2.14.0 or later)
- Open any fund page on Value Research Online — for example,
valueresearchonline.com/funds/19701/ppfas-flexi-cap-fund/ - Wait 3–4 seconds. A panel labelled ✨ MF Analysis appears in the page, above the fund's tab bar
- Click one of the three template buttons to generate your prompt
- Click Copy Prompt, then paste into your AI platform
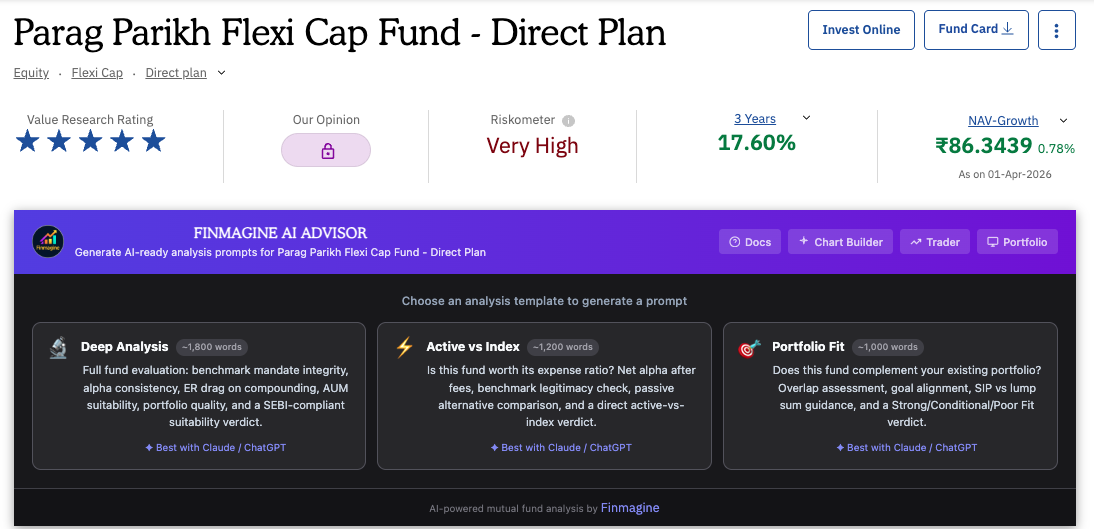
The panel embedded live on the PPFAS Flexi Cap Fund page — Deep Analysis, Active vs Index, and Portfolio Fit available in one click.
What Data the Panel Reads
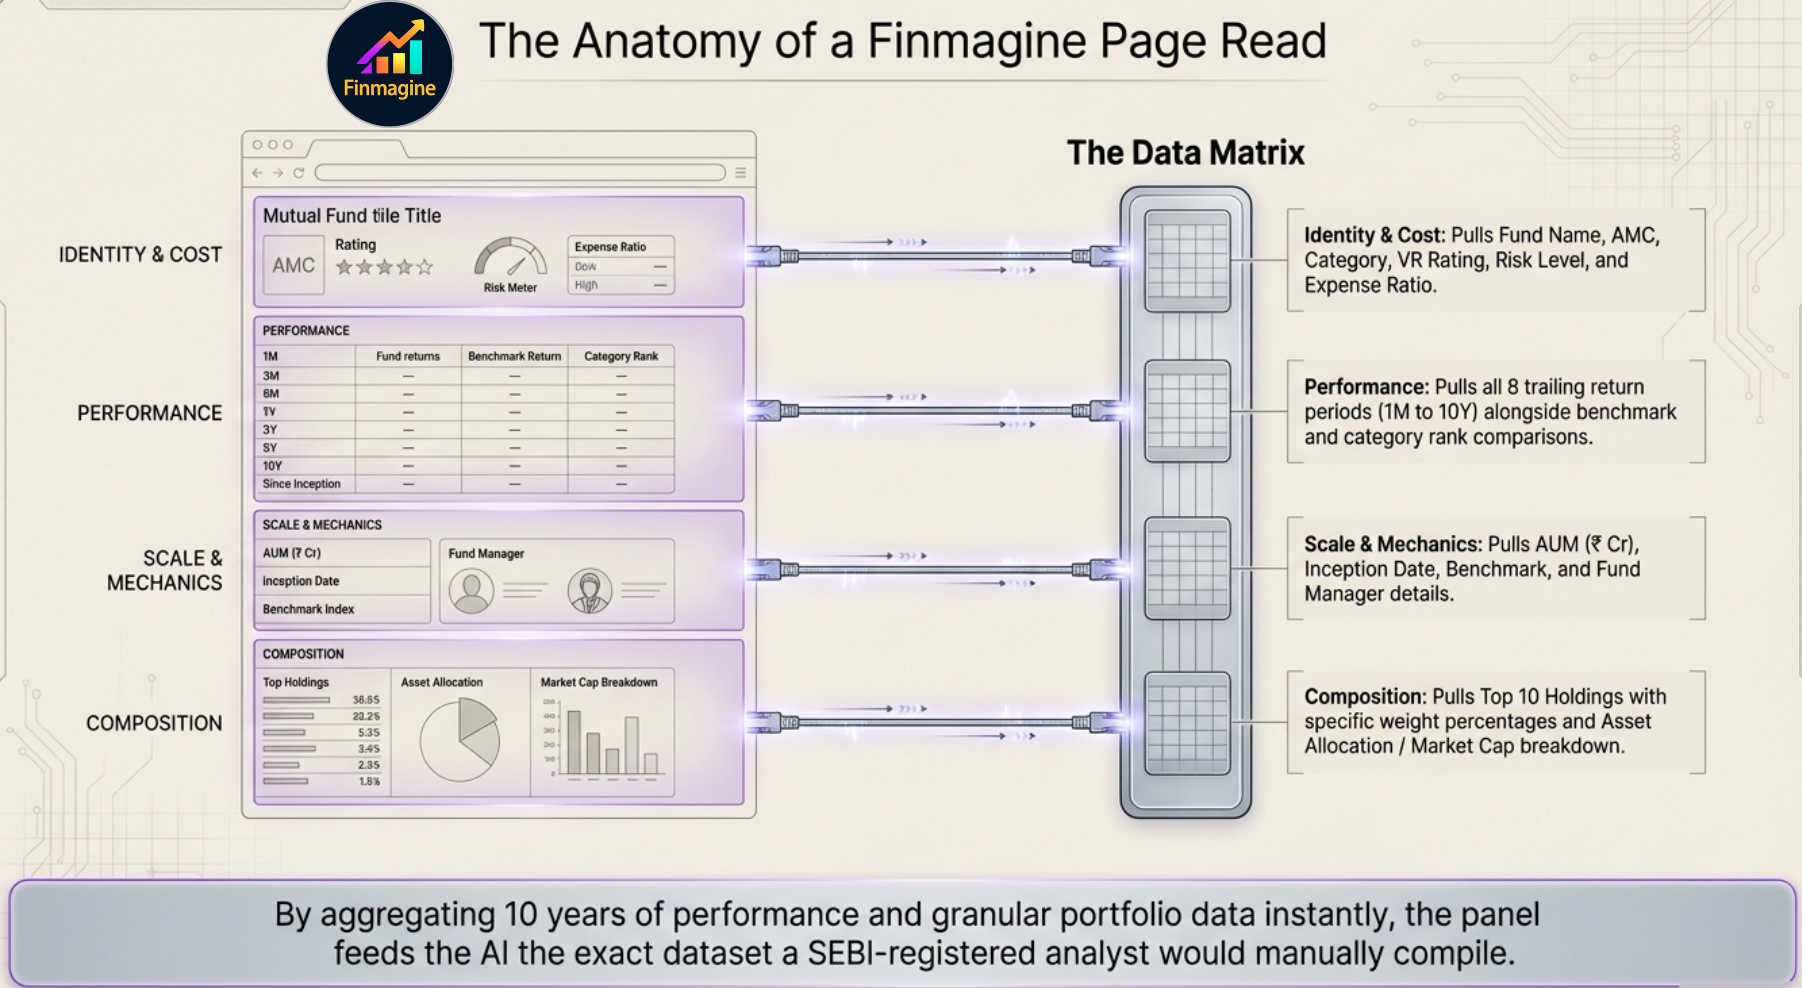
In 4 seconds, the panel assembles the exact dataset a SEBI-registered analyst would manually compile — fund identity, 8-period returns, fund mechanics, and holdings composition.
| Data Point | Used In |
|---|---|
| Fund name, AMC, category | All templates |
| Benchmark, fund manager | Deep Analysis, Active vs Index |
| Inception date, exit load | Deep Analysis |
| VR rating, risk level | Deep Analysis |
| Expense ratio (ER) | All templates |
| AUM (₹ Cr) | Deep Analysis, Active vs Index |
| Trailing returns — 8 periods (1M to 10Y): fund, benchmark, category, rank | All templates |
| Top 10 holdings + weights | Deep Analysis, Portfolio Fit |
| Asset allocation % and market cap breakdown % | Deep Analysis, Portfolio Fit |
The Three Templates
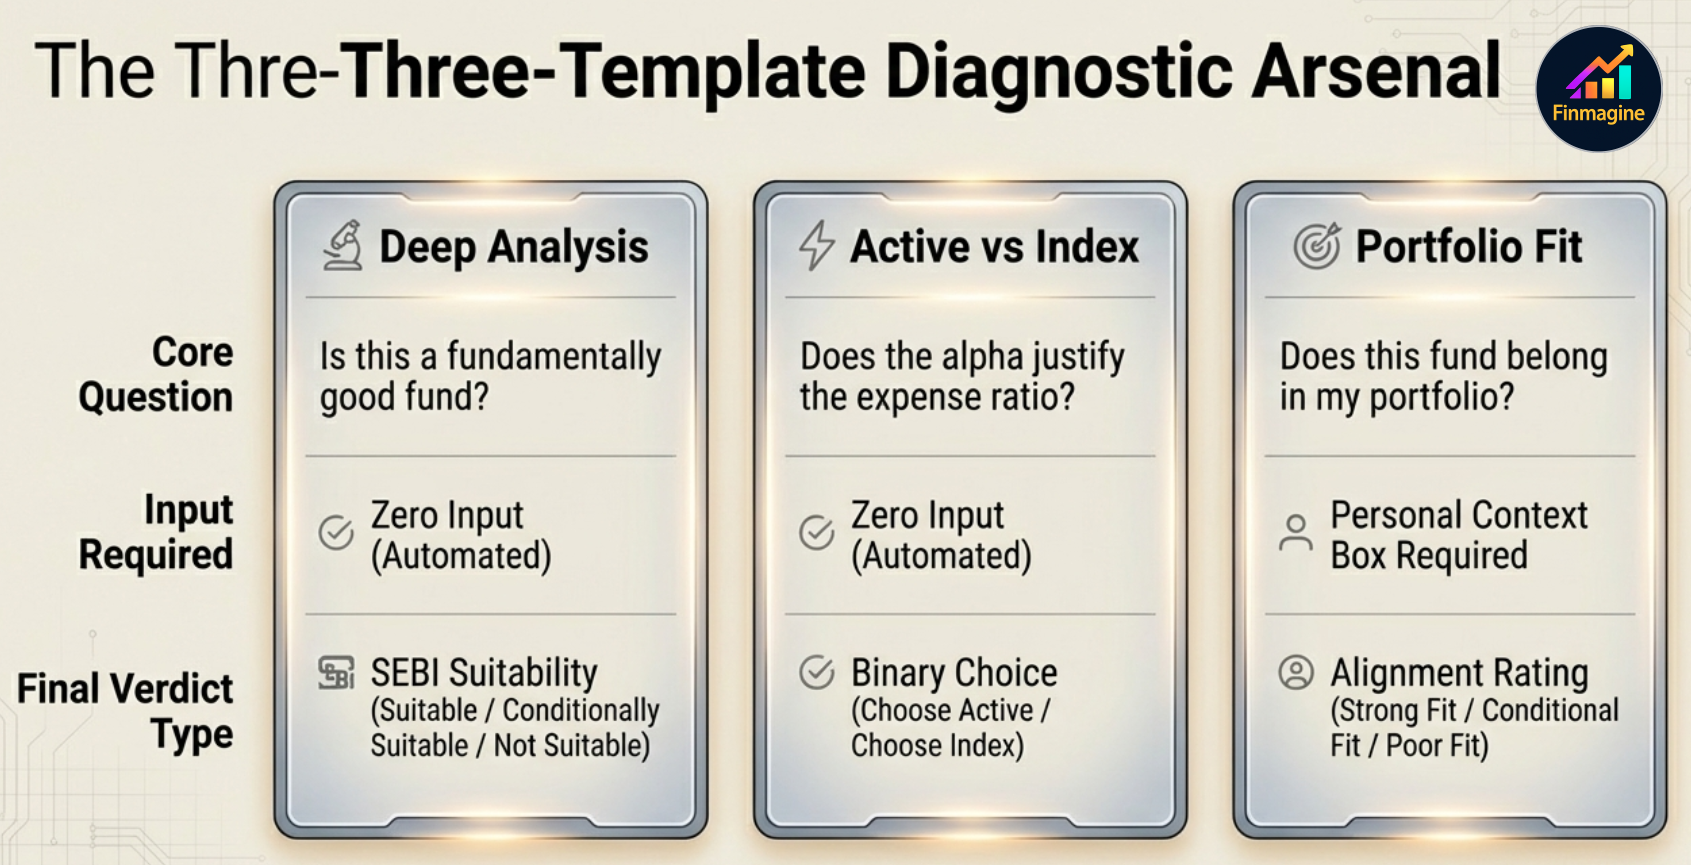
Three templates, three questions, three verdict types. The right choice depends entirely on what you are trying to decide.
What it answers: "Is this a good fund, and is it suitable for me as a general investor?"
What it produces: A ~1,800-word, 7-dimension fund audit ending in one of three SEBI-aligned verdicts: Suitable, Conditionally Suitable, or Not Suitable.
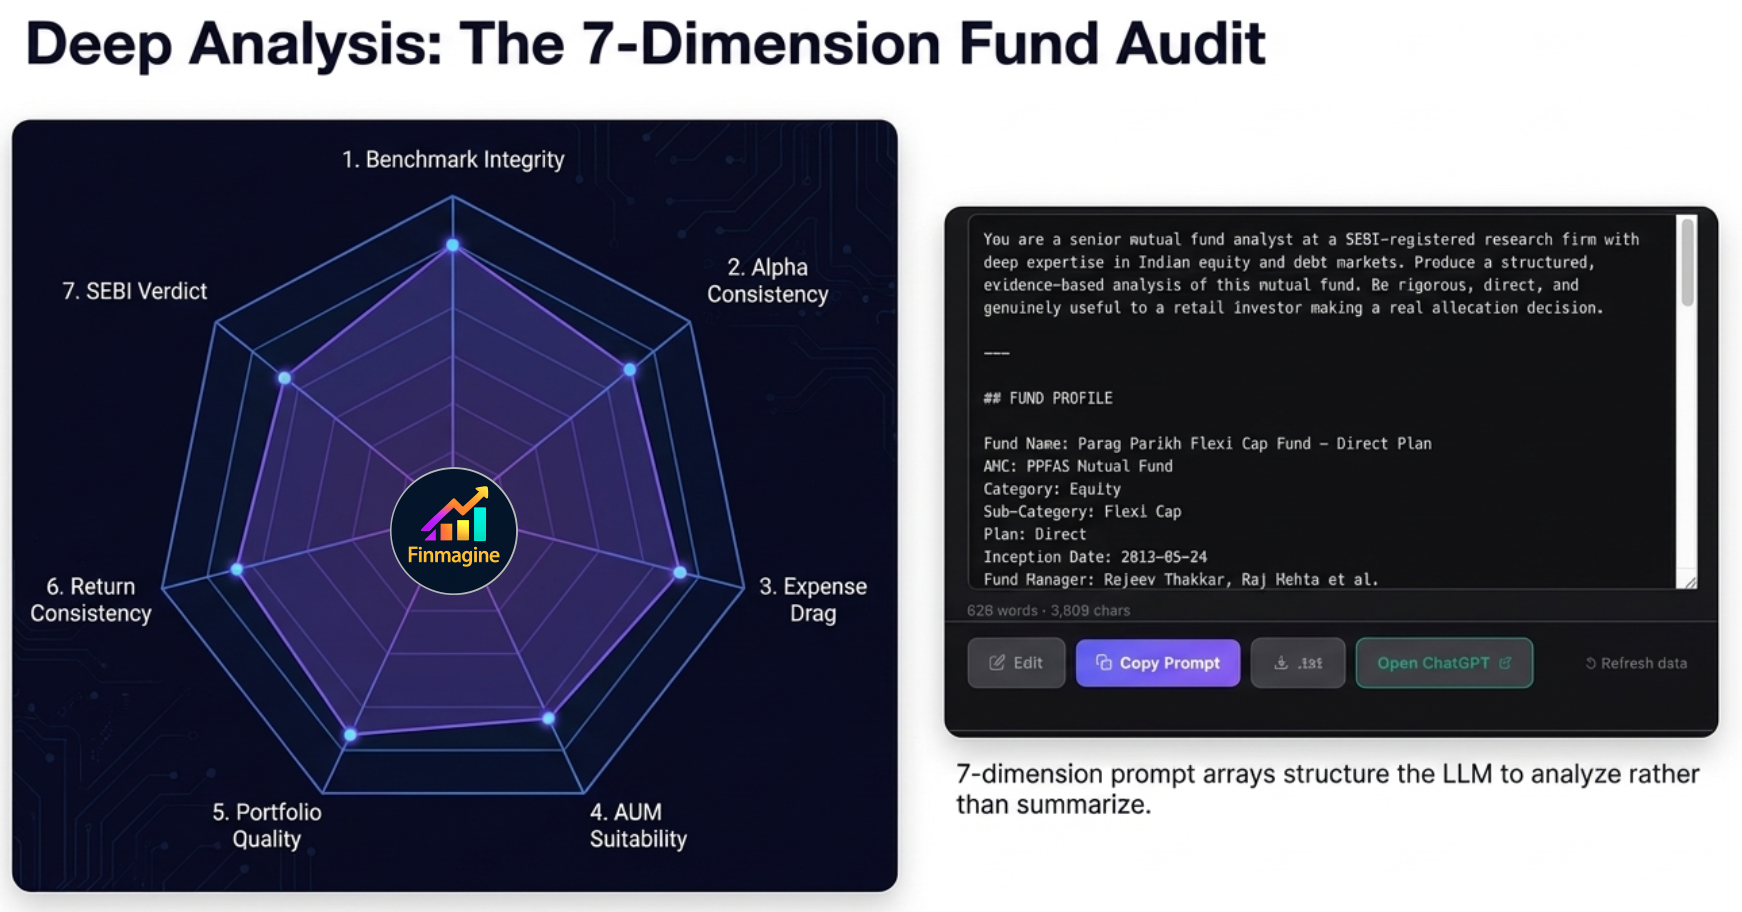
The 7-dimension structure forces the AI to analyse rather than summarise — each dimension audits a specific failure mode.
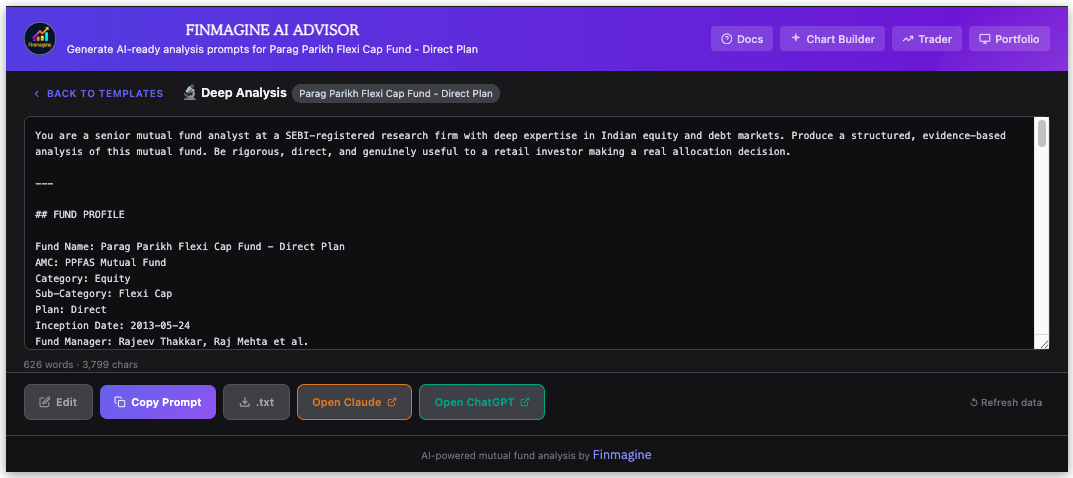
The generated Deep Analysis prompt for PPFAS Flexi Cap Fund — over 600 words of structured financial context ready to paste into your AI.
The 7 Dimensions — Explained
1. Benchmark Mandate Integrity
Does the fund invest where it promises? A large-cap fund claiming to target stable blue-chips should not have 30% in mid-cap companies. The AI cross-references the stated objective against the actual top 10 holdings and asset allocation. Style drift analogy: You hire a plumber to fix your kitchen pipes. You come home to find the plumber rewired your electrical panel instead — the work might be excellent, but it destroyed your carefully designed risk structure. In fund terms, if your mid-cap allocation starts buying large-caps because they "look cheap," your portfolio concentration changes without your permission.
2. Alpha Consistency and Decay
Anyone can get lucky for one year. The test of genuine active management is whether outperformance persists across 3Y, 5Y, 7Y, and 10Y. The AI checks for mean reversion — the gravity that pulls exceptional short-term performers back to the baseline as the fund grows, strategies become crowded, and luck runs out. A fund ranked top 1% over 1 year but sliding to the 50th percentile over 10 years is a rocket ship running out of fuel, not a compounder.
3. Expense Ratio Competitiveness
A 1.5% expense ratio looks innocuous in isolation. But compounded over 10 years at 12% CAGR on ₹10 lakhs, it erases lakhs of rupees that could have stayed in your account. The AI calculates the exact rupee drag and asks: does the net alpha — outperformance after fees — justify this cost versus an equivalent 0.10% index fund? If the fund beats its benchmark by 0.8% but charges 1.5%, you are paying a premium for negative net alpha.
4. AUM Suitability — The Paradox of Success
More AUM is good for the fund house (more fee revenue) but often bad for investors. The problem manifests differently by category: Small/mid-cap funds above ₹5,000–8,000 Cr face market impact costs — buying even a great small company drives its price up before the full position is built, forcing the manager to either water down convictions or drift into larger caps. Large-cap funds above ₹20,000 Cr face forced index-hugging — the only stocks liquid enough to absorb billions of rupees are the exact Nifty heavyweights. A ₹77,000 Cr large-cap fund like ICICI Prudential Large Cap is mathematically compelled to hold HDFC Bank, Reliance, ICICI Bank, and L&T at massive weights — because those are the only stocks deep enough. It has become an expensive index fund.
5. Portfolio Construction Quality
Are the top 10 holdings coherent with the mandate, or does the fund have 40% in IT stocks while marketing itself as a diversified flexicap? Are positions high-conviction and differentiated, or a list of the same Nifty names everyone else holds? The AI audits the receipts directly from the scraped holdings data.
6. Return Consistency vs Category
Absolute returns are a symptom of the broader market environment — a rising tide lifts all boats. Rank data is the honest metric: if the Nifty surges 25% and your fund gains 20%, you have underperformed, even though the absolute number looks great on your statement. Conversely, a fund that falls only 10% in a 30% market crash has delivered extraordinary value. The AI analyses percentile rank across every time period to separate skill from market luck — consistent top-quartile ranking is the signal; erratic top/bottom alternation is a warning.
7. SEBI-Compliant Suitability Assessment
The prompt forces a structured verdict — Suitable, Conditionally Suitable, or Not Suitable — tied directly to the evidence from dimensions 1–6. The AI must identify one thing the fund does exceptionally well and one specific risk that retail investors are likely underestimating. No fence-sitting. No "this is a well-managed fund with a strong track record."
Best used when: You are evaluating a fund from scratch, doing your first due diligence before investing, or reviewing a fund in your portfolio annually.
What it answers: "Does this fund's historical alpha justify paying its expense ratio, or should I just buy an index fund?"
What it produces: A focused cost-benefit evaluation ending in a direct verdict: Choose Active or Choose Index — with specific conditions attached.
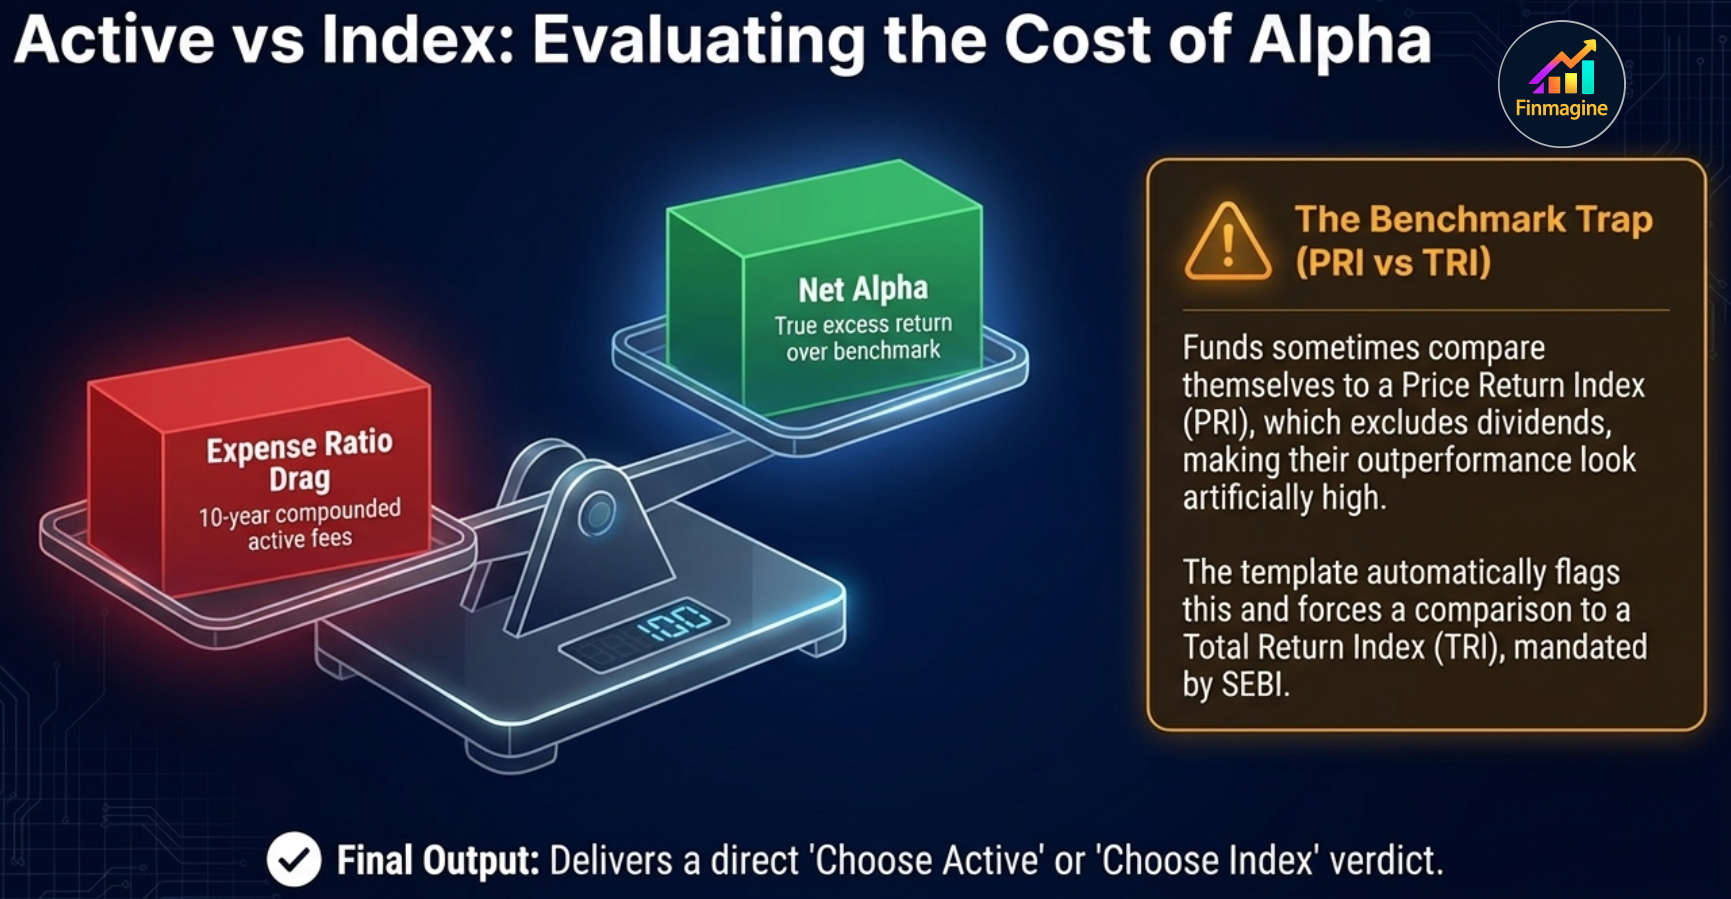
The benchmark trap: funds historically compared themselves to a Price Return Index (PRI) that excluded dividends — making their performance look artificially superior. SEBI mandated TRI in 2018, but the data requires active verification.
The TRI vs PRI Benchmark Trap
For decades, active fund managers presented marketing materials with their performance line soaring above the benchmark. What they did not prominently disclose was which type of benchmark they were comparing against. A Price Return Index (PRI) only measures capital appreciation — it excludes dividends. But the mutual fund collects those dividends and adds them to its total return. Using a PRI benchmark is the equivalent of winning a foot race after forcing your opponent to wear concrete shoes — you rigged the math so you couldn't lose. This could add 1.5–2% of artificial alpha every year.
SEBI mandated TRI benchmarks from 2018. But historical data still carries the distortion, and not all funds have fully corrected their presentations. The Active vs Index template automatically audits this, flags PRI comparisons, and forces a fair TRI-based evaluation.
Key analyses performed:
- Net alpha after fees — True excess return over the correct TRI benchmark, after subtracting the expense ratio
- Benchmark legitimacy check — Is the fund comparing itself to the right index? TRI or PRI? Correct composition?
- Best passive alternative — Which specific index fund or ETF is the fairest comparison?
- Alpha sustainability — Has the net alpha been consistent, or was it a one-period phenomenon?
Best used when: You are specifically weighing an active fund against its equivalent index fund — especially in large cap or multi-cap categories where passive alternatives are widely available and often cheaper.
What it answers: "Does this fund belong in MY portfolio, given what I already own and what I am trying to achieve?"
What it produces: A personalised portfolio construction assessment — not a standalone fund quality rating — ending in one of three verdicts: Strong Fit, Conditional Fit, or Poor Fit, plus a single actionable sentence.
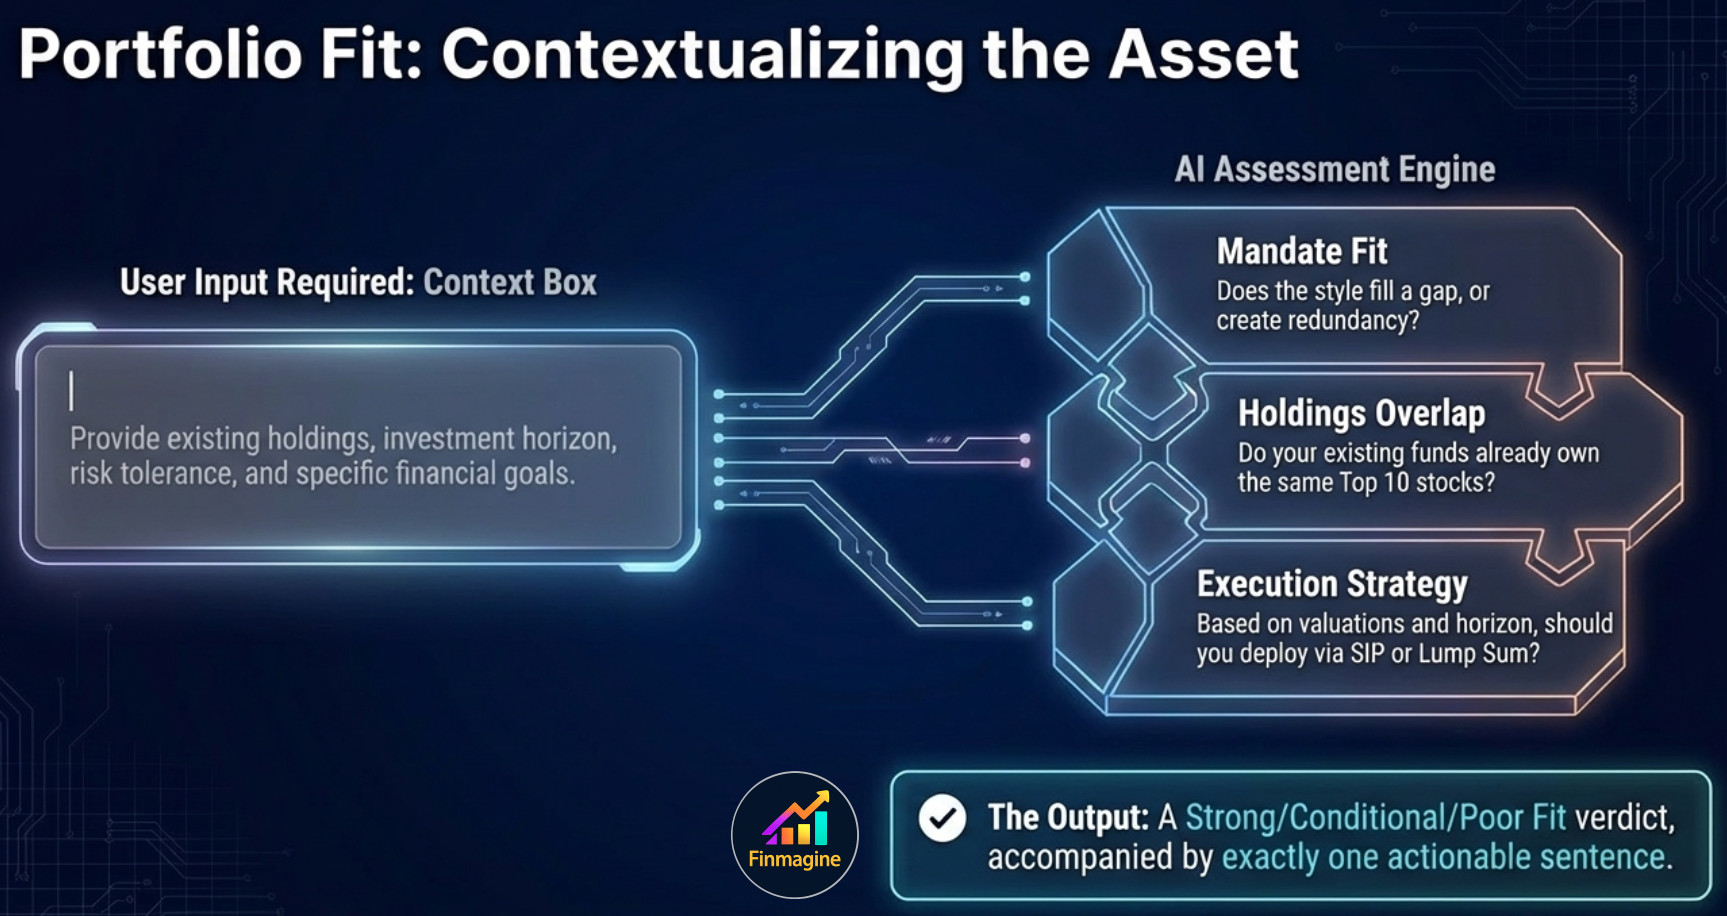
Portfolio Fit is the only template that requires your input — the context box is where the analysis becomes personal to your situation.
The Illusion of Diversification
The most common portfolio construction mistake is believing that owning multiple funds equals diversification. An investor adds a second highly-rated large-cap fund to their existing one. Then a third. Each was managed by a different company and appeared different on paper. But all three hold HDFC Bank, Reliance Industries, ICICI Bank, and L&T in their top 5 — because the Indian large-cap universe concentrates heavily at the top. Three funds with three different managers and three separate expense ratios, all owning the same 10 stocks. If the banking sector falls, all three crater simultaneously. Portfolio Fit cross-references the top 10 holdings of the new fund against your described portfolio and raises a red flag if significant overlap exists.
Requires your input: Before generating, you fill in a context box describing your existing portfolio, investment horizon, risk tolerance, and goals. The AI uses this context to assess:
- Mandate fit — Does the fund's category and style match a gap in your portfolio?
- Overlap — Do your existing funds already own the same top 10 stocks?
- Goal-mandate alignment — Does this fund's typical time horizon match yours?
- SIP vs lump sum guidance — Given current valuations and your horizon, which mode makes more sense?
- Position sizing — What allocation percentage is appropriate given your risk profile?
Best used when: You are already considering a fund and want to understand how it fits with what you already own — especially before adding a new fund category or consolidating an existing one.
Which Template to Use: The Decision Tree
The three templates answer different questions. Use this decision tree to pick the right one for your situation:
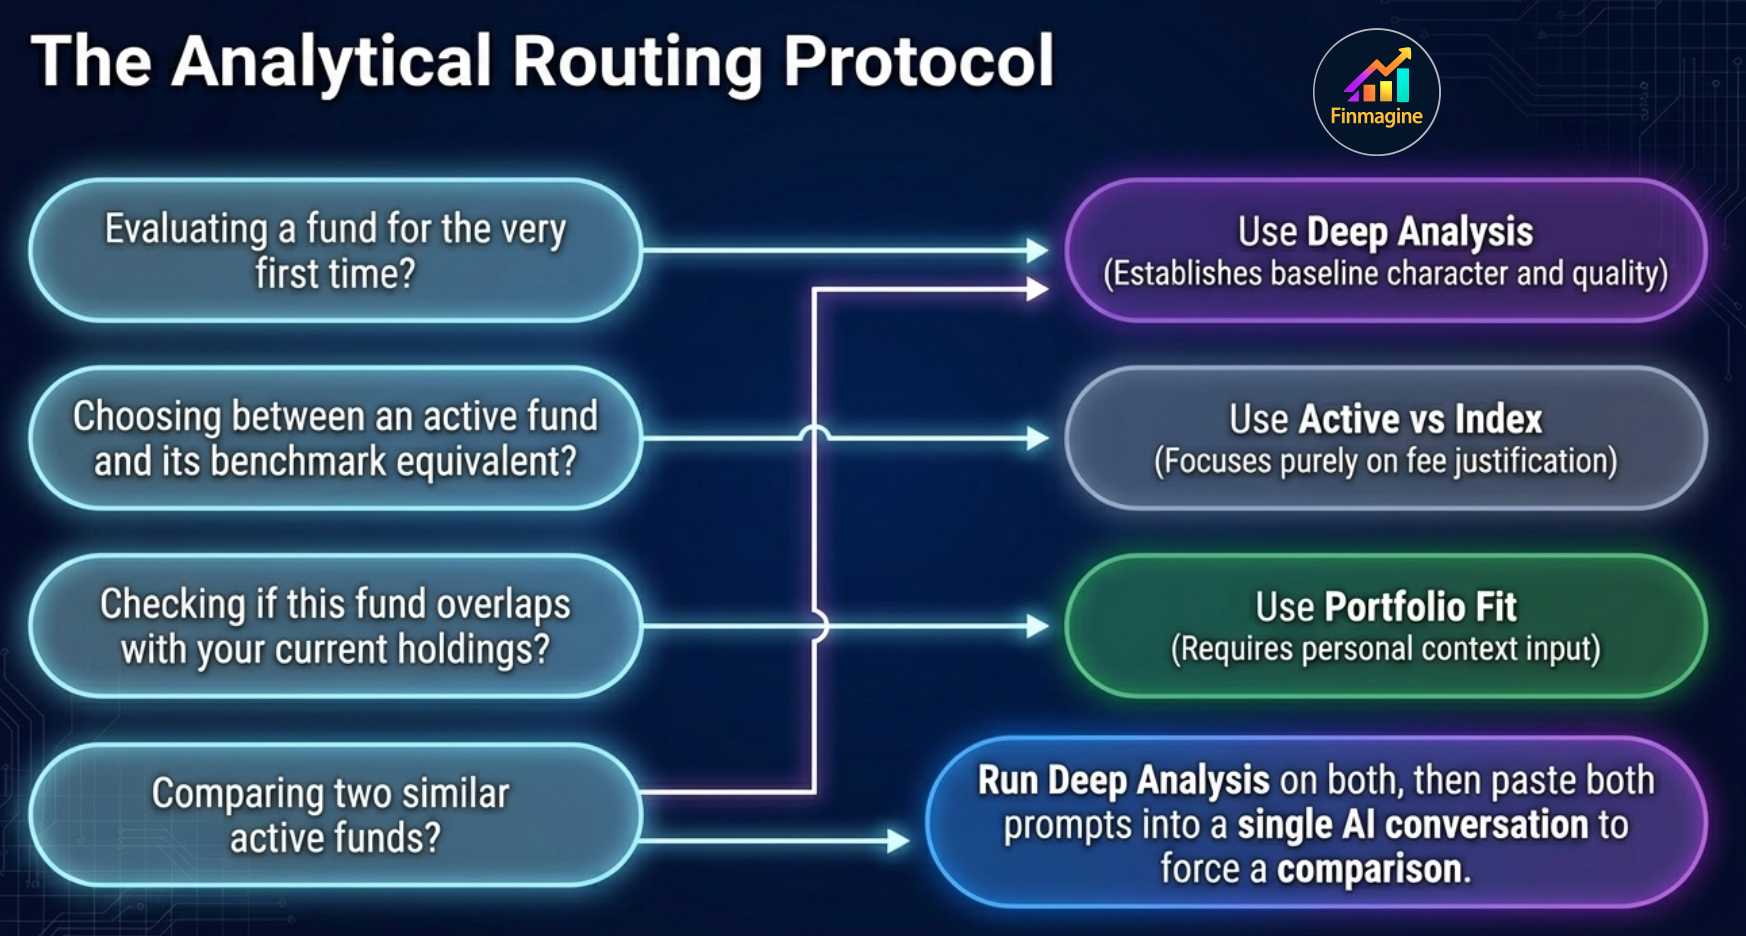
Four common scenarios, four clear routes. The analytical routing protocol eliminates choice paralysis.
🌳 MF Template Decision Tree
Practical Scenario Examples
| Your Situation | Best Template | Why |
|---|---|---|
| First time evaluating PPFAS Flexi Cap Fund | Deep Analysis | You need the full picture before forming an opinion |
| Deciding between HDFC Mid-Cap Opportunities Fund and Nifty Midcap 150 Index Fund | Active vs Index | Classic active-vs-passive question in a category with a good benchmark |
| You already own 3 large cap funds and are considering adding a 4th | Portfolio Fit | You need overlap analysis and mandate fit, not a standalone quality score |
| Annual portfolio review — checking each fund you hold | Deep Analysis for each | Reassess quality, alpha decay, and AUM growth since you invested |
| Comparing two similar funds before choosing one | Deep Analysis on both, then compare | Run Deep Analysis on each, paste both outputs into a single AI conversation and ask for comparison |
| New to mutual funds, evaluating your first fund | Deep Analysis | Most thorough, most educational — covers all the dimensions you need to understand |
The Power User Workflow
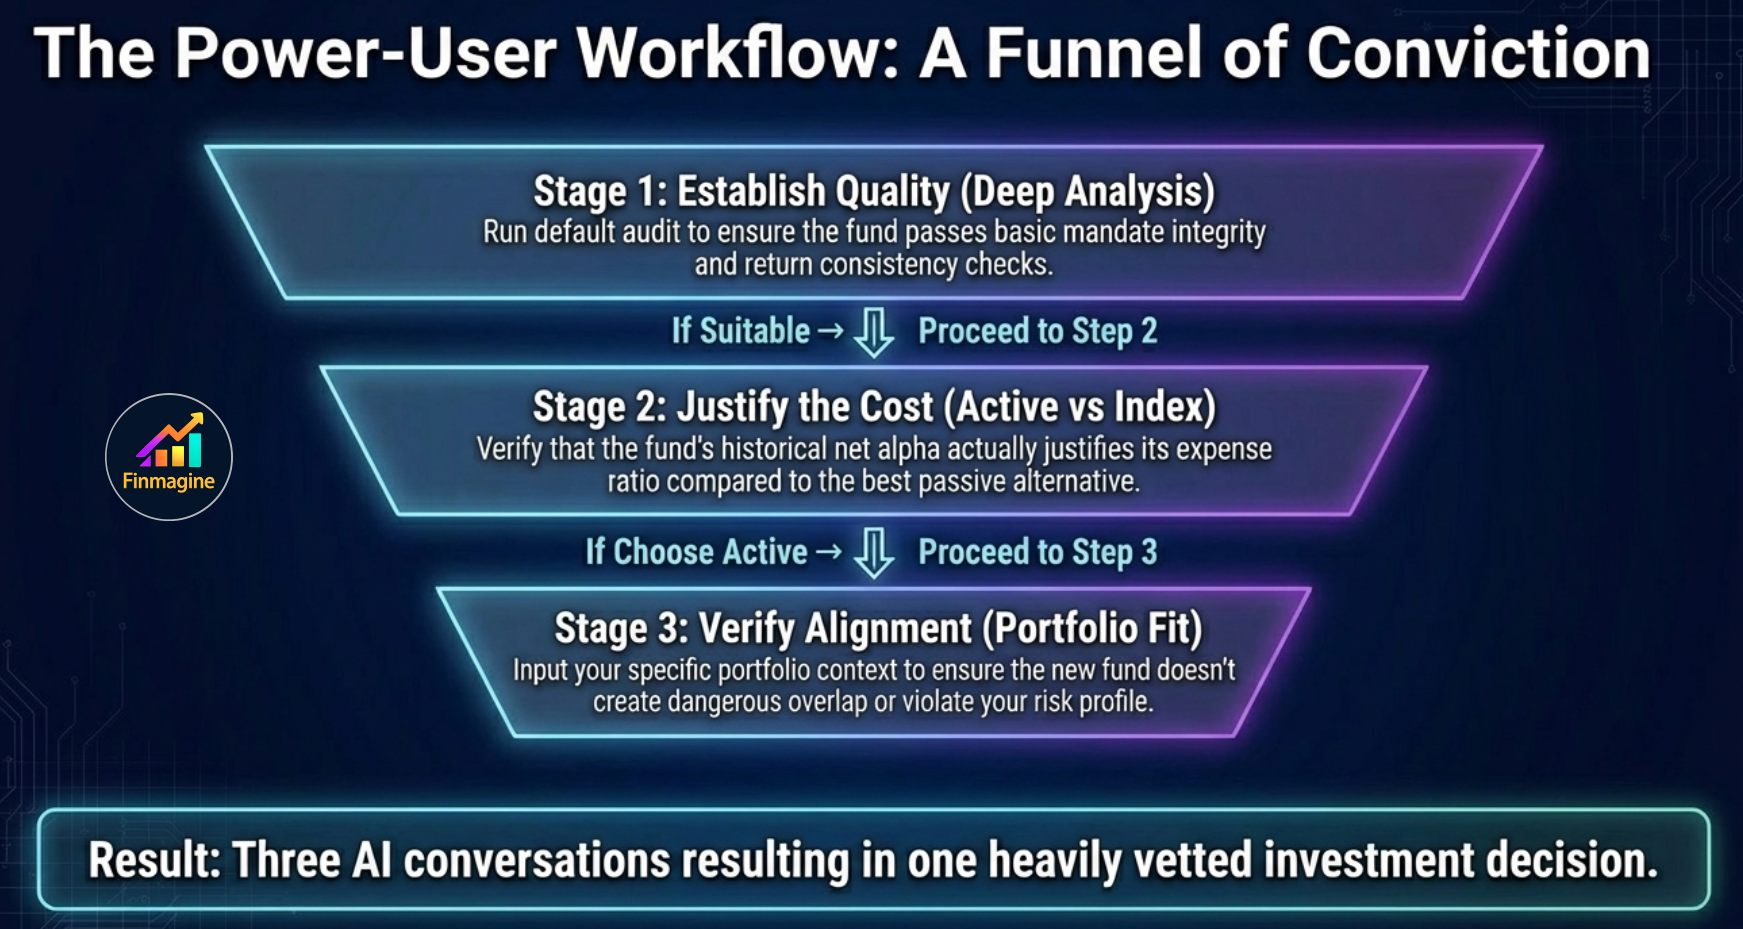
Three AI conversations, one heavily-vetted investment decision. Each stage only proceeds if the previous stage passes.
Which AI to Paste Into
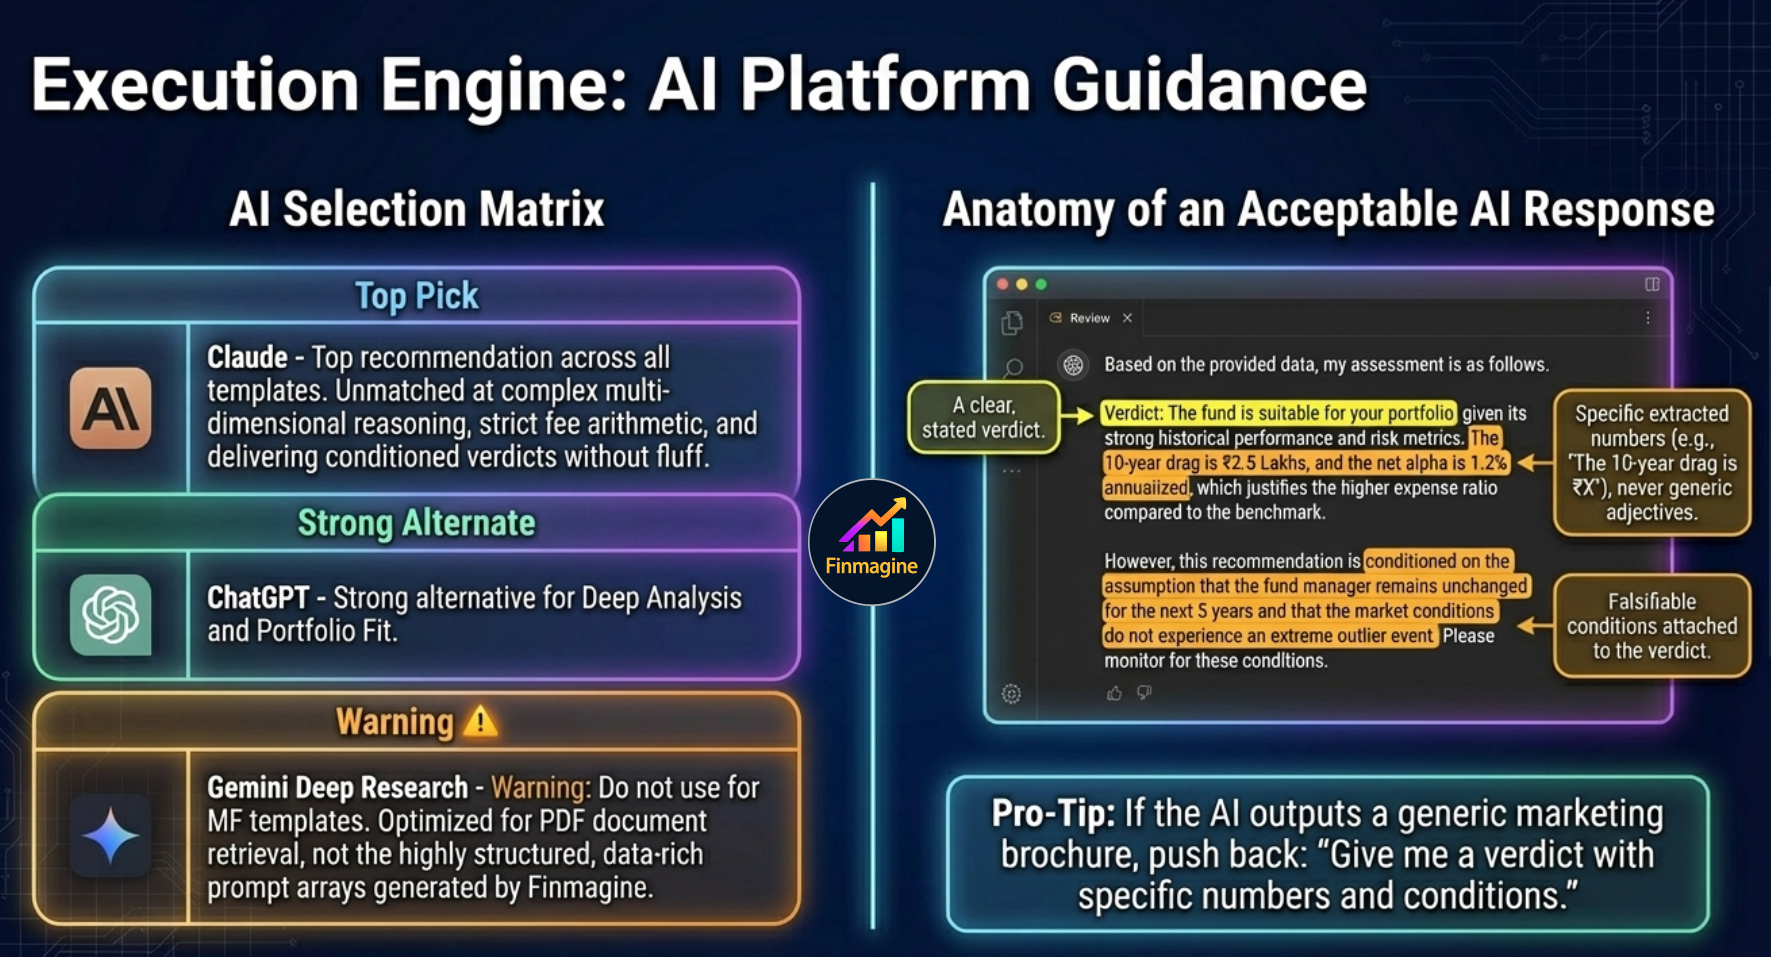
Platform selection matters — especially for the Active vs Index template. Gemini Deep Research is explicitly not recommended for these structured, data-rich prompts.
The Finmagine panel generates a structured text prompt. You copy it and paste it into any AI of your choice. For mutual fund analysis, the recommendations are:
| Template | First Choice | Second Choice | Why |
|---|---|---|---|
| Deep Analysis | Claude | ChatGPT | Complex multi-dimensional reasoning; Claude's structured output is particularly strong for verdicts with conditions |
| Active vs Index | Claude | ChatGPT | Requires rigorous fee arithmetic and benchmark logic; Claude handles the net alpha math more reliably without hallucinating phantom expense ratios |
| Portfolio Fit | Claude or ChatGPT | — | Both handle personalised context well; choose whichever you use regularly |
What to Expect from the AI Output
A well-structured AI response to any of the three templates should include:
- A clear, stated verdict (Suitable / Conditionally Suitable / Not Suitable, or Choose Active / Choose Index, or Strong Fit / Conditional Fit / Poor Fit)
- Specific numbers from the prompt used to support each claim — not generic statements
- Quantified reasoning: "The 10-year expense drag at 12% CAGR is ₹X per lakh" rather than "the expense ratio is high"
- Conditions attached to verdicts — what would need to change for the verdict to flip
- A single actionable sentence you can act on immediately
Deeper Reading: The Full Tutorial Series
This article is your entry point. The full series covers each template in detail:
- Deep Analysis: A 7-Dimension Mutual Fund Audit — Full walkthrough of all 7 dimensions, with PPFAS Flexi Cap Fund as the case study
- Reading the Deep Analysis Output — What Suitable / Conditionally Suitable / Not Suitable actually means for your investment decision, and when to override the verdict
- Active vs Index: Does Your Fund's Alpha Justify Its Cost? — Concept piece and template walkthrough; which categories almost always lose this test
- Portfolio Fit: What to Write in the Context Box — Good vs bad context examples, what to include, why vague context produces vague verdicts
- Portfolio Fit in Practice: Building a Diversified MF Portfolio with AI — Applied walkthrough with a real 3-fund portfolio evaluating a 4th addition
Start Your Mutual Fund Analysis with AI
Install Finmagine AI Advisor, visit any mutual fund page on Value Research Online, and choose your template. Deep Analysis, Active vs Index, and Portfolio Fit are available from day one.
Get Finmagine AI Advisor →Free Chrome Extension
Ready to try this yourself?
Install the Finmagine AI Advisor and generate institutional-grade research prompts from any Screener.in or stockanalysis.com company page in seconds.
Install from Chrome Web Store →No account required • Works on Chrome, Edge, Brave, Opera