๐Ÿ”ฌ Deep Analysis: A 7-Dimension Mutual Fund Audit

Every Dimension Explained โ€” with PPFAS Flexi Cap Fund as the Case Study

Following along? Install the extension first

Finmagine AI Advisor — free • no account needed • Chrome, Edge, Brave

Install Free →
Published: April 2, 2026  |  Updated: April 3, 2026  |  25 min read  |  Deep Dive Tutorial  |  Part 2 of the VRO MF Series
The 7-Dimension Mutual Fund Audit Playbook โ€” Finmagine AI Advisor case study: PPFAS Flexi Cap Fund
๐ŸŽง Listen to this article

๐Ÿ“š Multimedia Learning Hub

Master the 7-dimension Deep Analysis framework through video, audio, and interactive flashcards

What You Will Learn

The 7-Dimension Mutual Fund AI Audit โ€” circular overview of all dimensions

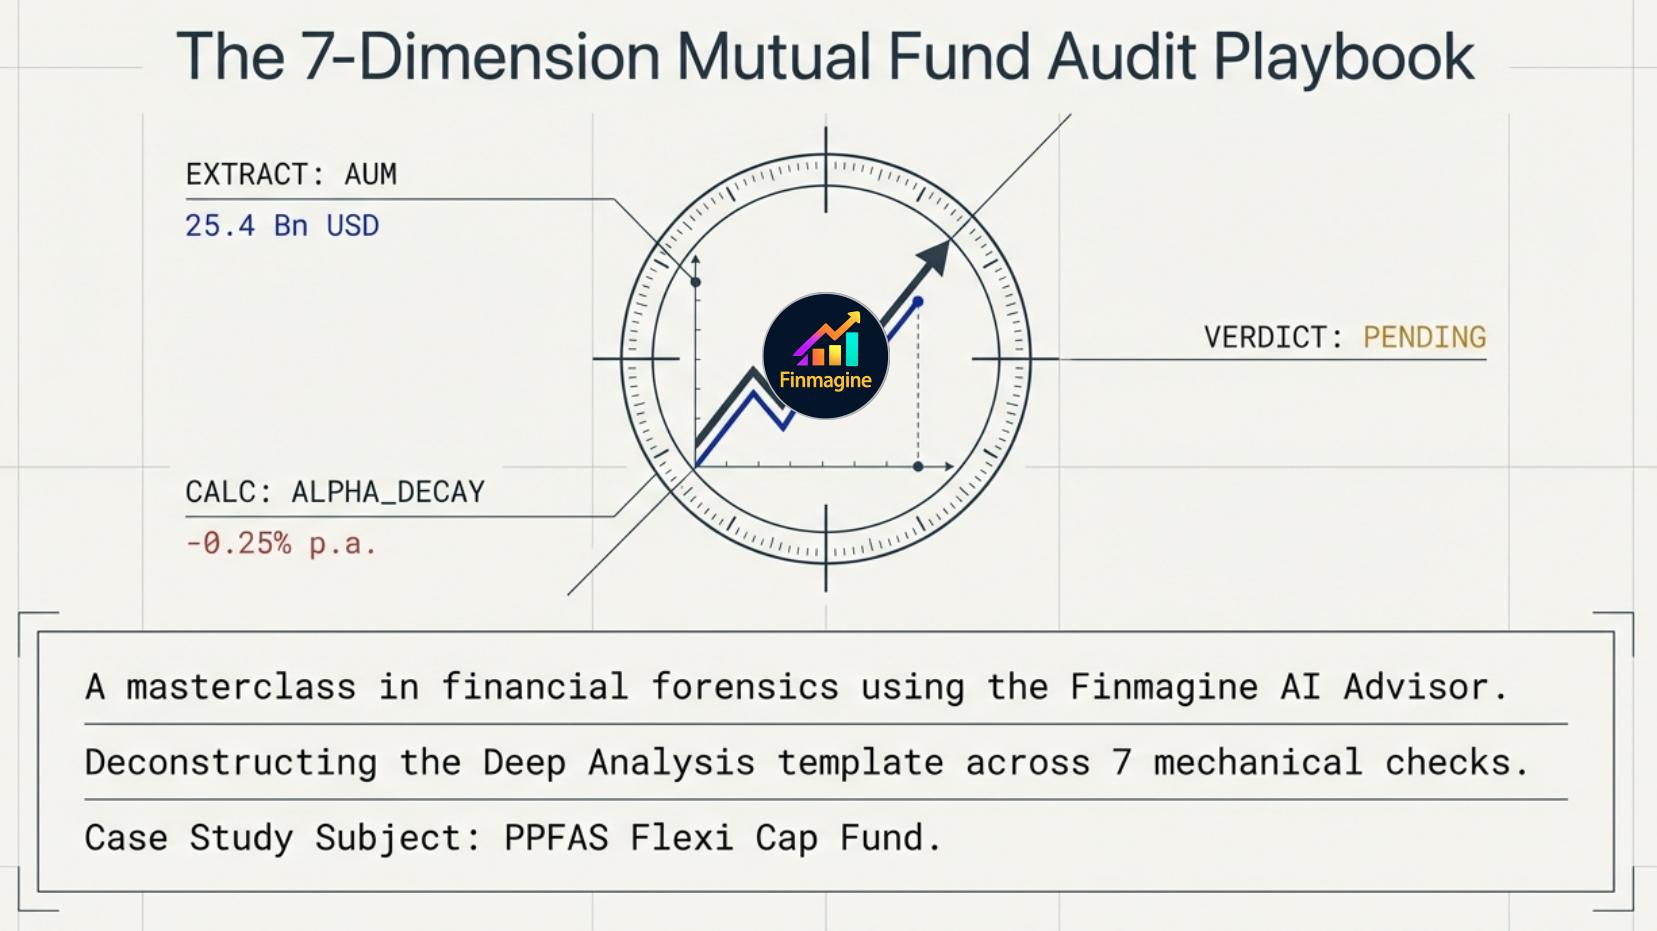
This article is a complete walkthrough of the Deep Analysis template in Finmagine AI Advisor v2.14.0 โ€” the most comprehensive of the three mutual fund templates. It covers all 7 dimensions the AI evaluates, with PPFAS Flexi Cap Fund (VRO fund ID 19701) as the worked example throughout.

The 7 Dimensions Covered:

  • Dimension 1 โ€” Benchmark Mandate Integrity: Is the fund invested where it claims? Is the benchmark fair (TRI not PRI)?
  • Dimension 2 โ€” Alpha Consistency and Decay: Does outperformance hold across all 8 time periods, or does it fade as AUM grows?
  • Dimension 3 โ€” Expense Ratio Competitiveness: 10-year compounded rupee cost drag โ€” the number that makes abstract percentages real
  • Dimension 4 โ€” AUM Suitability: Has fund size grown to the point where strategy execution is impaired?
  • Dimension 5 โ€” Portfolio Construction Quality: Do the top holdings reflect the stated mandate, or is it closet indexing?
  • Dimension 6 โ€” Return Consistency vs Category: First quartile consistently, or random quartile rotation?
  • Dimension 7 โ€” SEBI Suitability Verdict: Suitable / Conditionally Suitable / Not Suitable โ€” with explicit conditions

Watch: The Hidden Truth About Mutual Funds (You're Losing More Than You Think)

A deep dive into how mutual funds actually work โ€” and what they don't want you to notice. Uses the PPFAS Flexi Cap Fund case study to walk through the 7-dimension framework.

Topics: Why benchmark comparisons were misleading for years ยท Alpha decay and how it kills performance ยท How fund size (AUM) destroys returns ยท The true cost of a 0.87% fee over 10 years ยท Why 5-star ratings don't guarantee future returns.

60 flashcards โ€” click any card to reveal the answer
What is Dimension 1 of the Deep Analysis template in the Finmagine AI Advisor?
Benchmark Mandate Integrity.
Dimension 1 checks if a fund is actually invested in the category its _____ implies.
Name.
What is the primary difference between a Price Return Index (PRI) and a Total Return Index (TRI)?
A TRI includes reinvested dividends in the return calculation, while a PRI only includes price appreciation โ€” making TRI the honest apples-to-apples benchmark.
Why is a PRI benchmark considered misleading for evaluating mutual fund performance?
It artificially lowers the benchmark return by excluding dividends, making the fund appear to outperform more than it actually does โ€” by approximately 1โ€“2% per year.
Since what date has SEBI mandated that mutual funds use TRI benchmarks for comparison?
January 2018.
What is 'Alpha Decay' as defined in Dimension 2 of the audit framework?
The narrowing of a fund's outperformance (excess return) over time as its AUM increases โ€” when a fund is too large to take concentrated mid/small-cap positions, its alpha gradually trends toward zero.
How does Dimension 2 assess 'Alpha Consistency'?
By checking if positive alpha is maintained across all available time horizons (1M, 3M, 6M, 1Y, 3Y, 5Y, 7Y, 10Y) rather than being concentrated in one favourable period.
Why do large funds often drift toward large-cap stocks and index-like portfolios?
Increased AUM requires larger, more liquid positions to avoid moving market prices. A โ‚น50,000 Cr fund taking a 10% position would need to buy an entire โ‚น5,000 Cr small-cap company โ€” impossible without destroying the trade economics.
How is the 10-year expense drag calculated in Dimension 3?
It computes the difference between โ‚น1 Lakh compounded at the fund's gross return (before ER) and the same amount compounded at the net-of-expense return. The rupee difference is the total fee paid over a decade.
What is the purpose of the Dimension 3 calculation compared to just stating the Expense Ratio percentage?
It expresses the cost as a concrete rupee amount of 'lost wealth' over a decade, making the cost drag intuitive โ€” e.g. a 0.87% ER quietly extracts โ‚น23,000 per lakh over 10 years at 12% gross return.
What is the 'Capacity Concern Threshold' for AUM in small-cap funds?
โ‚น5,000 Cr or more โ€” beyond this, buying meaningful small-cap positions drives prices up before the full position is built (market impact cost).
At what AUM level do mid-cap funds generally start facing a meaningful liquidity drag?
โ‚น20,000 Cr to โ‚น50,000 Cr โ€” above โ‚น50,000 Cr a pure mid-cap strategy is mathematically paralysed.
What is the AUM range where Large Cap and Flexi Cap funds begin to face suitability concerns?
โ‚น60,000 Cr to โ‚น80,000 Cr โ€” beyond this, the fund is forced into the same Nifty heavyweights that dominate the index, degrading its ability to generate alpha.
How does AUM impact the execution of mid and small-cap fund mandates?
The fund may be forced into larger stocks because it cannot buy sufficient quantities of small stocks without excessively moving their prices โ€” effectively causing style drift into the large-cap universe.
In Dimension 5, what is considered a 'risk flag' regarding portfolio concentration?
A top 3 holding weight exceeding 40โ€“50% โ€” indicating hyper-concentration where a single management decision could crater half the fund's value.
What does 'Closet Indexing' refer to in the context of portfolio construction quality?
A portfolio where the top 10 holdings mirror standard index stocks in market-cap order โ€” suggesting the fund manager is not genuinely active but charging active management fees for effectively passive exposure.
Dimension 6 evaluates return consistency by examining the fund's _____ rank across multiple periods.
Category rank โ€” which strips away the effect of bull markets and reveals whether the manager genuinely outperforms peers under all conditions.
What pattern of ranking identifies a 'genuine consistent outperformer' in Dimension 6?
Consistently staying in the top quartile (rank โ‰ค 25%) across the 5Y, 7Y, and 10Y horizons โ€” establishing a dynasty, not a one-year lottery win.
What does an erratic rank pattern with strong absolute returns typically suggest?
The performance is driven by tactical bets or luck that may not be repeatable โ€” a fund bouncing between top and bottom quartile is gambling, not systematically investing.
What are the three possible SEBI-compliant suitability verdicts produced in Dimension 7?
Suitable, Conditionally Suitable, and Not Suitable.
Under what condition is a fund labeled 'Conditionally Suitable'?
When the fund is fundamentally sound but has a specific concern (e.g., high AUM, recent manager change, international allocation causing cyclical underperformance) that investors must consciously accept.
What defines a 'Not Suitable' verdict in the Deep Analysis framework?
The fund fails on enough dimensions โ€” such as negative net alpha after fees, impaired strategy execution due to AUM, or manipulated benchmarks โ€” that a mathematical autopsy reveals the disqualifying flaws.
Why is PPFAS Flexi Cap Fund considered a complex case for Dimension 1?
Its benchmark (Nifty 500 TRI) is imperfect because it does not fully reflect the fund's significant international equity allocation of up to 35% in US-listed stocks like Alphabet, Meta, and Amazon.
What is the maximum international stock allocation permitted for the PPFAS Flexi Cap Fund?
35% โ€” capped by SEBI's industry-wide limits on total capital Indian mutual funds can remit overseas.
What specific risk does the international allocation of PPFAS introduce relative to Indian peers?
Potential 1โ€“3 year underperformance during periods of Indian Rupee (INR) strength or US market weakness โ€” when the domestic Nifty rallies but US tech corrects, PPFAS looks terrible in that 12-month window regardless of stock-picking skill.
Why is the tenure of Rajeev Thakkar important for the PPFAS case study?
Having the same manager since inception (May 2013) makes the long-term track record a reliable indicator of management skill โ€” not just lucky benchmark timing or multiple manager cycles.
In Dimension 4, why is AUM considered irrelevant for Index Funds or ETFs?
Passive execution is not hindered by size as it simply tracks market-cap weights in liquid securities โ€” scale actually improves efficiency for index funds.
What is the 'Thesis Clarity' check in Dimension 5?
Determining if the top holdings tell a consistent investment story (e.g., value-oriented quality businesses domestic + international) or if the portfolio is just a random collection of large-cap names with no discernible philosophy.
According to the framework, why should an analyst 'push back' if an AI response reads like a fund brochure?
To ensure the AI provides an explicit suitability verdict backed by specific numerical data (expense ratios, alpha figures, AUM) rather than generic language like "well-managed fund with strong track record."
Which AI models are recommended for running the Deep Analysis template?
Claude or ChatGPT โ€” both handle the 7-dimension structured reasoning and produce conditioned verdicts reliably.
Why is Gemini Deep Research considered less suitable for the Deep Analysis template?
It is optimized for live web browsing, whereas the Deep Analysis task requires structured reasoning over data already contained in the prompt โ€” sending Gemini to search the web corrupts the clean dataset the panel assembled.
What AUM level was noted for the ICICI Prudential Large Cap Fund in the case study data?
โ‚น77,452 Cr.
What is the Expense Ratio of the ICICI Prudential Large Cap Fund โ€” Direct Plan?
0.87%.
What was the 5-year alpha for the ICICI Prudential Large Cap Fund in the performance data?
+2.9%.
In Dimension 5, what range of top 3 holding weight signals healthy 'conviction' for an active fund?
25% to 35% โ€” high enough to demonstrate genuine conviction, low enough to avoid concentration risk.
What does a consistent 'Top Half' ranking suggest about a fund's quality?
The fund is reliable and solid, but not necessarily exceptional โ€” consistently beating half its peers without reaching top-quartile dominance.
In Dimension 1, what percentage of assets must a 'Large Cap' fund maintain in large-cap stocks to comply with SEBI rules?
At least 80%.
What constitutes 'Style Drift' in a mid-cap mutual fund?
The fund holding significant large-cap names to manage liquidity, deviating from its mid-cap mandate โ€” like a restaurant claiming to serve authentic curry but serving plain pasta.
In Dimension 3, the AI compares the fund's expense ratio against the _____ and the cheapest equivalent index fund.
Category median.
What is the primary evidence used in Dimension 1 to verify mandate adherence?
The portfolio's market cap breakdown and the top 10 holdings โ€” the AI reads what the fund actually owns, not what the marketing brochure claims.
How does Dimension 2 define a 'Yellow Flag' for large funds?
A pattern where alpha narrows as the time period lengthens (1Y alpha > 3Y alpha > 10Y alpha) โ€” the compression wedge that signals the fund's growth is eating its own performance.
What is the specific 10-year rupee drag for PPFAS Direct mentioned in the case study?
Approximately โ‚น12,000 per lakh (at 13% gross return) โ€” significantly lower than the โ‚น23,000 drag at ICICI's 0.87% ER.
Why does Dimension 7 attach explicit conditions to a 'Conditionally Suitable' verdict?
To inform the investor exactly what must be true (e.g., a 7+ year horizon, acceptance of cyclical underperformance) for the fund to remain appropriate โ€” turning a vague "good fund" into an actionable investor-specific assessment.
In the ICICI Large Cap analysis, what was the fund's rank in its category over the 10-year period?
2/42 โ€” second out of 42 peer funds over 10 years.
What is the 'Mandate Coherence' check in Dimension 5?
Verifying that the asset allocation between equity, debt, and cash matches the fund's stated category โ€” a "pure equity" fund holding 20% debt is breaching its mandate coherence.
Why might a fund's short-term rank be variable despite strong long-term performance?
Market cycles or specific structural features (like international exposure) may cause temporary divergence from peers โ€” the AI distinguishes cyclical underperformance from genuine deterioration.
What specific international holdings are typical for the PPFAS Flexi Cap Fund?
Alphabet, Meta, and Amazon โ€” US-listed technology companies that create a barbell structure alongside high-cashflow Indian names like Coal India, ITC, and Bajaj Holdings.
What was the Value Research Rating for the ICICI Prudential Large Cap Fund in the provided data?
5/5.
Which dimension evaluates whether outperformance is 'genuine' or merely 'style-driven'?
Dimension 6 (Return Consistency vs Category) โ€” by using category rank rather than absolute returns to strip away market-tide effects.
What determines if a benchmark choice is 'defensible' in Dimension 1?
If the benchmark broadness and type (TRI) accurately reflect the fund's actual investment universe โ€” PPFAS's Nifty 500 TRI is defensible but imperfect given the 35% international allocation.
How long does it take for the Finmagine AI Advisor panel to appear on a VRO fund page?
3โ€“4 seconds โ€” the panel waits for VRO's lazy-loaded returns data to populate before assembling the prompt.
What is the primary risk investors underestimate in large-cap funds with high AUM?
The tendency to become a 'closet indexer' โ€” forced into the same Nifty 50 heavyweights, generating index-like returns while charging active management fees.
What does the AI look for in the 'Thesis Clarity' portion of Dimension 5?
Whether the holdings follow a clear investment style, such as value-oriented quality businesses โ€” PPFAS's domestic defensives + international tech tells a coherent barbell thesis.
In the ICICI example, what is the 'BSE 100 TRI'?
The officially declared benchmark for the ICICI Prudential Large Cap Fund โ€” a TRI-compliant benchmark covering the top 100 companies by market capitalisation.
What is the 'Plan' type for both the PPFAS and ICICI funds used in the source examples?
Direct Plan โ€” which has lower expense ratios than Regular Plans since no distributor commission is included.
Why is 'AUM Suitability' (Dimension 4) a particular concern for PPFAS despite being a Flexi Cap fund?
The โ‚น85,000 Cr size constrains its ability to deploy capital into its highest-conviction international holdings due to SEBI's industry-wide regulatory cap on overseas remittances โ€” fresh inflows cannot be easily deployed into US tech positions.
What is the SEBI Risk Level for the ICICI Prudential Large Cap Fund?
Very High.
What does a 'Bottom Quartile' rank across most periods signify in Dimension 6?
A chronic underperformer โ€” failing to justify its active management fees and likely delivering worse returns than a cheap passive index fund.
According to the Deep Analysis framework, Dimension 2 calculates alpha as fund return minus _____.
Benchmark return (over the same period, using the fund's declared TRI benchmark).
In Dimension 3, 'Net Return' refers to the fund's return _____ the expense ratio.
After โ€” gross return minus the expense ratio drag gives the net return actually received by the investor.

Why Star Ratings Aren't Enough

Generic Brochure Checks vs. Deep Forensic Audits โ€” what the standard check misses vs what Finmagine AI measures

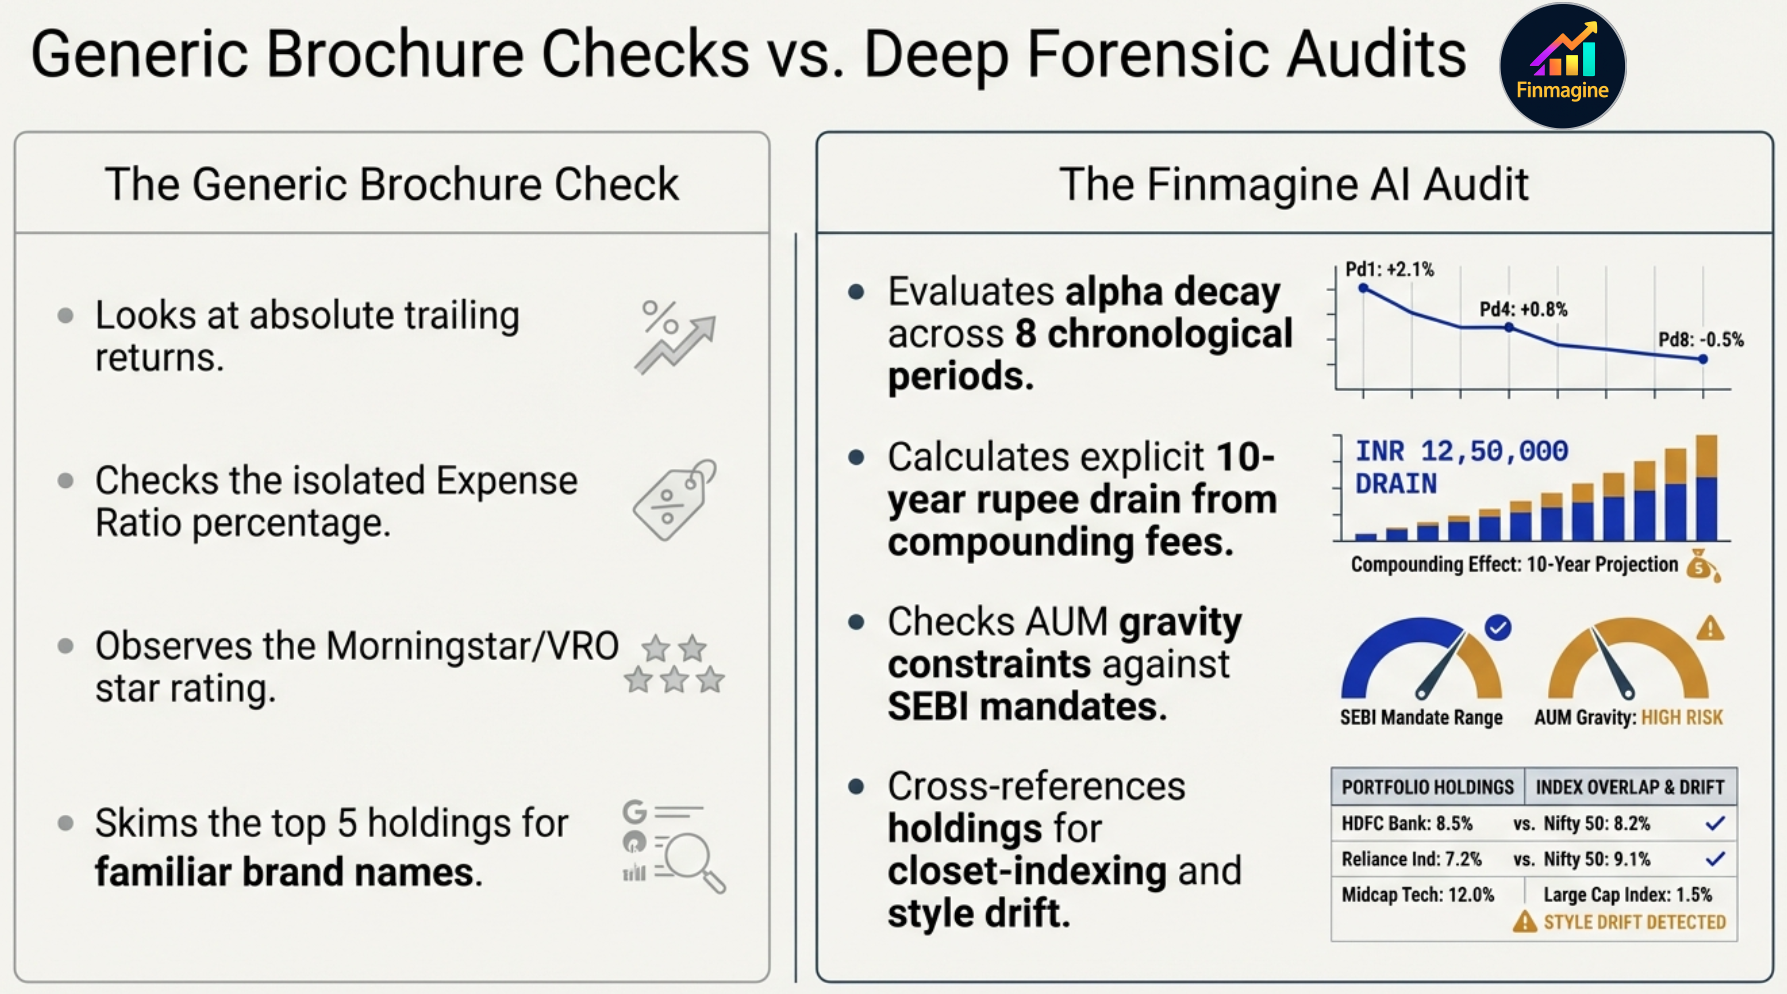
The standard brochure check looks at the surface. The 7-dimension forensic audit goes under the hood.

Every mutual fund fact sheet is a masterpiece of selective disclosure. The five-star badges, the beautiful line chart that only ever goes up-and-to-the-right, the star fund manager profiled in financial magazines โ€” they are all carefully curated to guide you toward one conclusion: buy this fund.

The problem is not that the data is false. It is that the data shown is the data that flatters. Absolute trailing returns sound impressive in a bull market โ€” every fund goes up. A 0.87% expense ratio looks negligible in isolation. AUM growth signals success to the retail investor while it quietly destroys the fund's ability to generate alpha.

โŒ The Generic Brochure Check

  • Looks at absolute trailing returns
  • Checks the isolated Expense Ratio %
  • Observes the Morningstar / VRO star rating
  • Skims the top 5 holdings for familiar names

โœ… The Finmagine AI Forensic Audit

  • Evaluates alpha decay across 8 chronological periods
  • Calculates the explicit 10-year rupee drain from compounding fees
  • Checks AUM gravity constraints against SEBI mandates
  • Cross-references holdings for closet-indexing and style drift

The Deep Analysis template does not read the brochure. It reads the evidence โ€” the actual holdings, the actual returns against the correct benchmark, the actual AUM trajectory โ€” and applies a structured 7-dimension framework to produce a verdict no marketing department can pre-approve.

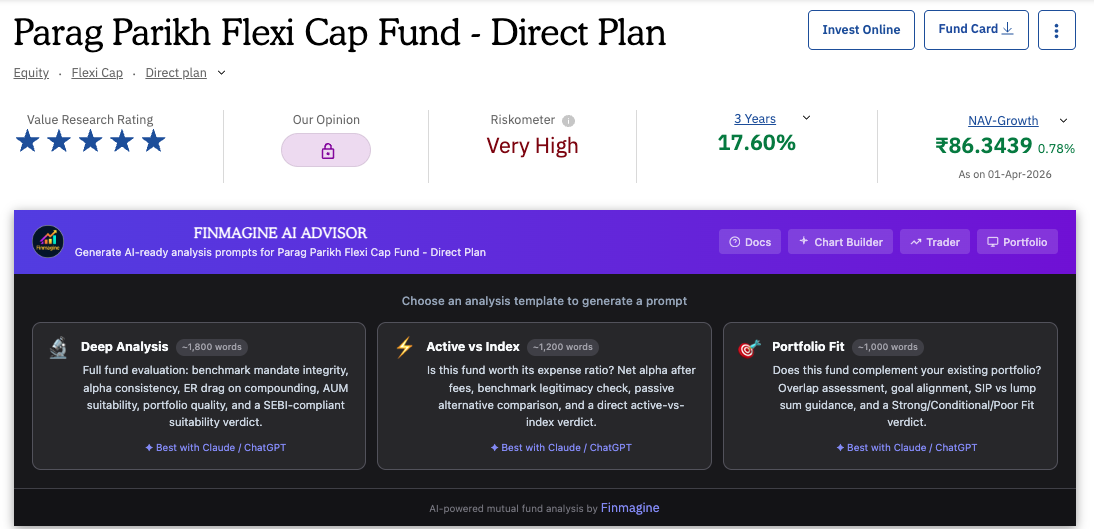
Before You Run the Template

Deploying the Deep Analysis Template โ€” the Finmagine panel on PPFAS page showing why PPFAS is the ideal case study

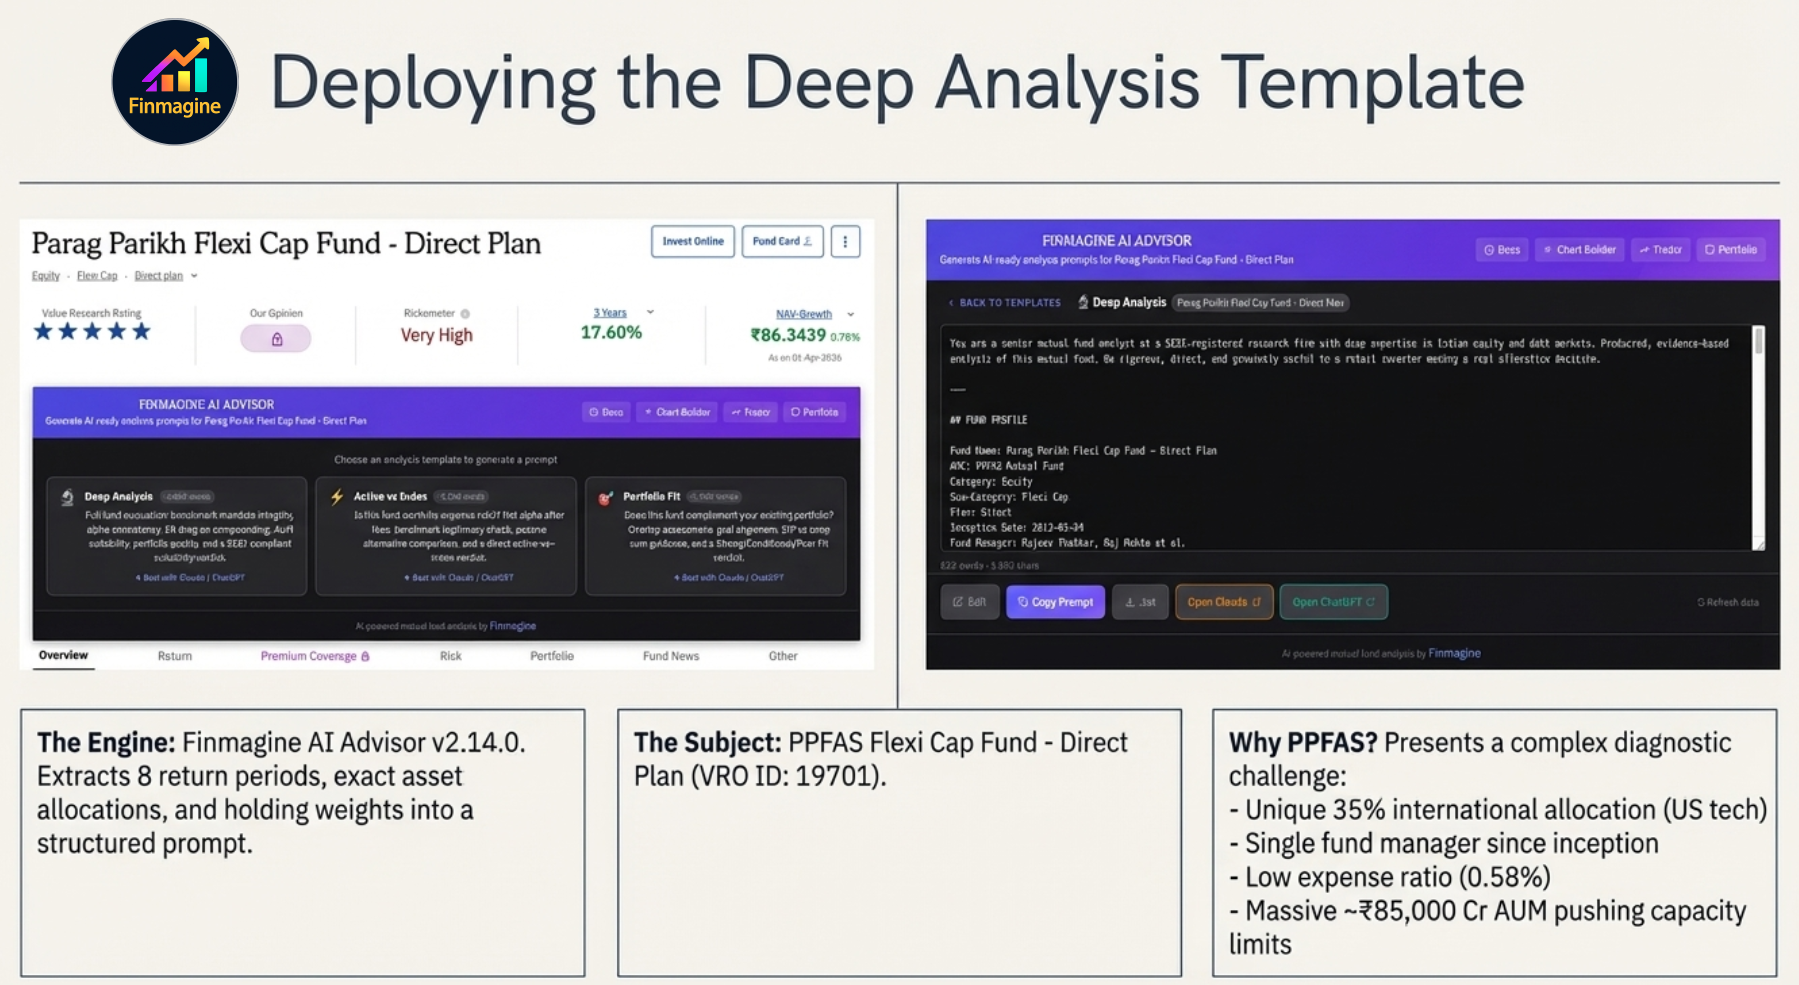
The Finmagine AI Advisor panel on the PPFAS Flexi Cap Fund page โ€” Deep Analysis selected, prompt assembled, ready to copy.

Open any VRO fund detail page. The Finmagine AI Advisor panel appears within 3โ€“4 seconds. Click Deep Analysis, wait a moment for the prompt to assemble, then click Copy Prompt. Paste into Claude or ChatGPT.

PPFAS Flexi Cap Fund on VRO with Finmagine panel showing three template buttons

The panel embedded on the PPFAS VRO page โ€” three templates available, Deep Analysis selected.
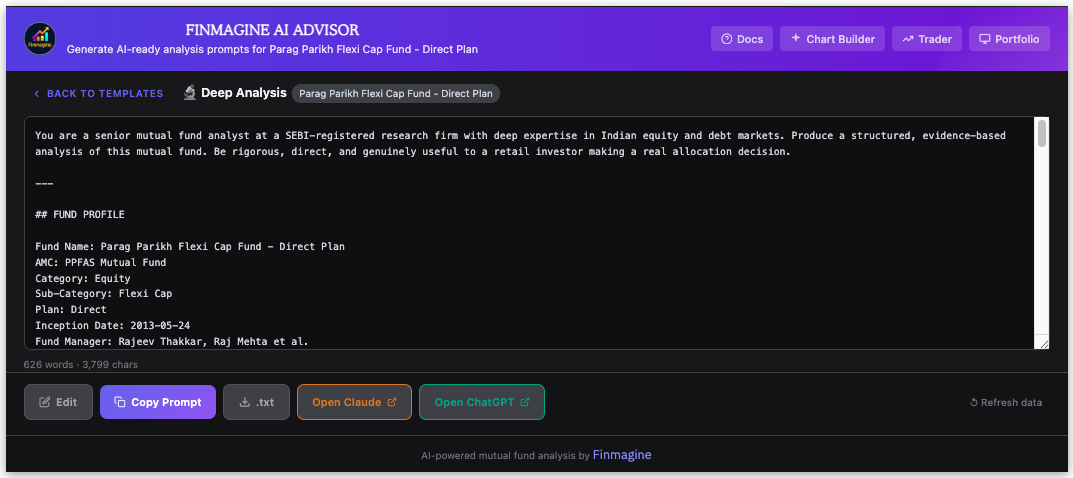
Deep Analysis prompt generated and displayed in the Finmagine panel โ€” 626 words of structured financial context

The generated Deep Analysis prompt โ€” ~1,800 words of structured financial context, all populated automatically from the VRO page data.

๐Ÿ’ก Why PPFAS as the case study: PPFAS Flexi Cap Fund (VRO ID 19701) is arguably the most structurally complex fund in the Indian ecosystem. It holds a perfect 5/5 VRO rating, an AUM of ~โ‚น85,000 Cr, and up to 35% in international stocks (Alphabet, Meta, Amazon) alongside domestic names. It has the same fund manager since inception in May 2013 โ€” Rajeev Thakkar. Every dimension of the audit is non-trivial: the benchmark is imperfect, the alpha is genuine but under pressure from AUM, the ER is among the lowest in its category, and the verdict is "Conditionally Suitable" despite the five-star badge. That makes it a far more instructive test case than a simple vanilla fund.

The 7 Dimensions โ€” Explained

Dimension 1
Benchmark Mandate Integrity
"Is this fund actually doing what it says it does, and is it benchmarking itself fairly?"
Dimension 1: Benchmark Mandate Integrity โ€” PRI vs TRI scale, mandate adherence Venn diagram, PPFAS telemetry

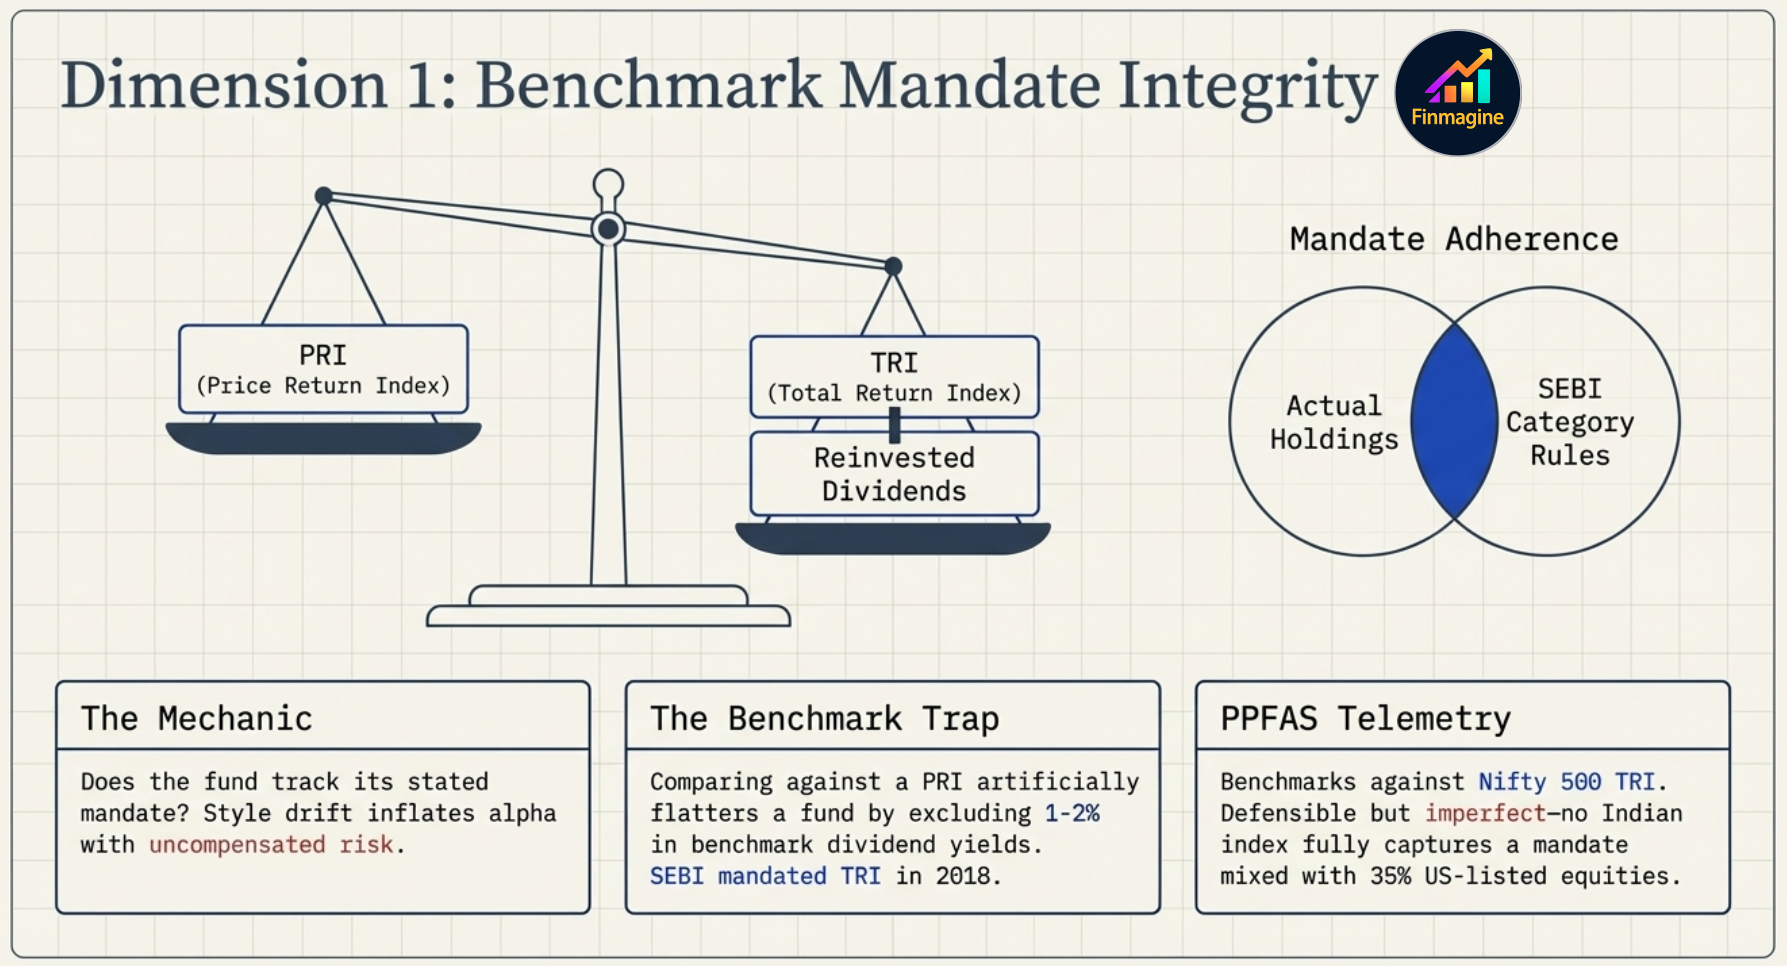
The benchmark trap: a PRI comparison flatters every fund by 1โ€“2% annually. SEBI mandated TRI from 2018 โ€” but the AI still verifies compliance.

This dimension has two sub-checks. First, mandate adherence: does the portfolio's actual composition match its SEBI category? A fund categorised as "Large Cap" must maintain at least 80% in large cap stocks. The top 10 holdings and market cap breakdown are the evidence โ€” not the marketing brochure.

Second, benchmark legitimacy. For decades, mutual fund managers compared their dividend-collecting funds against a Price Return Index (PRI) that conveniently excluded dividends from its calculation. If a stock stays flat but pays a โ‚น5 dividend, the PRI records 0% growth while the fund's NAV rises. This manufactured 1โ€“2% annual outperformance was entirely fabricated โ€” winning a foot race by making your opponent run in concrete shoes. SEBI ended this in January 2018 by mandating Total Return Index (TRI) benchmarks. The AI verifies full compliance.

PPFAS Telemetry: PPFAS benchmarks against Nifty 500 TRI โ€” a broad, TRI-compliant benchmark appropriate for a fund with up to 65% domestic equity. The AI flags the benchmark as defensible but imperfect โ€” no Indian index fully captures a mandate with 35% US-listed technology stocks. It notes the comparison will always be slightly asymmetric and alerts the investor to this structural context before examining any return numbers.
Dimension 2
Alpha Consistency and Decay
"Does the outperformance hold across all 8 time periods, or does it fade as AUM grows?"
Dimension 2: Alpha Consistency and Decay โ€” the compression wedge chart showing alpha declining as AUM gravity increases

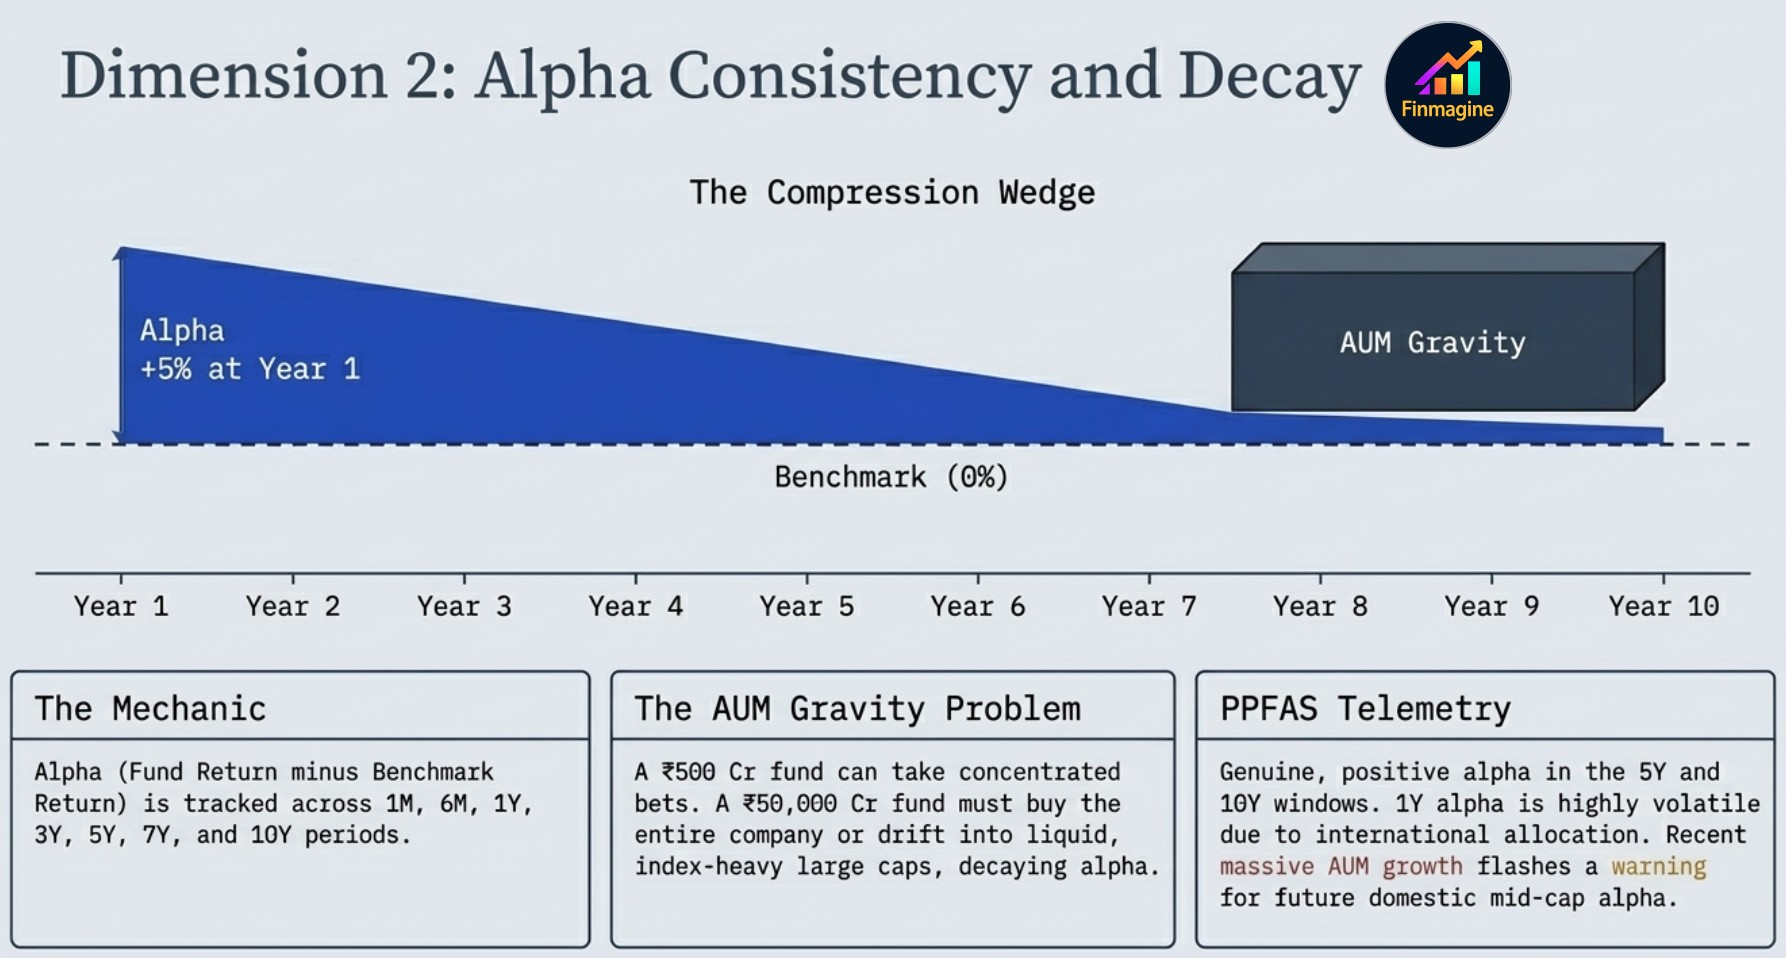
The compression wedge: alpha generated at โ‚น500 Cr AUM cannot survive at โ‚น50,000 Cr โ€” the fund becomes too large to execute the trades that built the track record.

Alpha is fund return minus benchmark return for each period. The Deep Analysis template computes this across all 8 available periods (1M, 3M, 6M, 1Y, 3Y, 5Y, 7Y, 10Y) and hunts for two patterns:

  1. Consistency: Is alpha positive across most periods โ€” or concentrated in one lucky window?
  2. Decay: Does alpha narrow as the time period lengthens? A yellow flag: 1Y alpha > 3Y alpha > 10Y alpha, narrowing toward zero as AUM grew.
โš ๏ธ The AUM-alpha physics story: A nimble โ‚น500 Cr fund discovers an undervalued manufacturer with a โ‚น5,000 Cr market cap. Taking a 10% position costs โ‚น50 Cr โ€” 1% of the company, executed quietly over a few days. The stock doubles. The fund earns 5% pure alpha. Word spreads. Money floods in. Five years later, AUM has swelled to โ‚น50,000 Cr. The manager finds the same type of opportunity. A 10% position now requires โ‚น5,000 Cr โ€” the entire market cap of the target company. Impossible. They are forced into Reliance, HDFC Bank, and ICICI Bank instead โ€” the same stocks the Nifty 50 holds. The speedboat became a supertanker. Alpha decays to zero not because the manager lost their skill, but because success took away their maneuverability.
PPFAS Telemetry: Genuine, positive alpha over 5Y and 10Y periods โ€” Thakkar's long-term track record is real. But 1Y alpha is highly volatile, swinging based on INR/USD dynamics and US market cycles rather than stock-picking skill. The AI interprets this correctly: short-term volatility is a structural feature of the international mandate, not evidence of decay. However, the massive AUM growth flashes a forward-looking warning for domestic mid-cap alpha opportunities.
Dimension 3
Expense Ratio Competitiveness
"How much is this fund actually costing you, expressed in rupees over 10 years?"
Dimension 3: Expense Ratio Competitiveness โ€” bar chart showing gross vs net final value with the rupee fee extracted

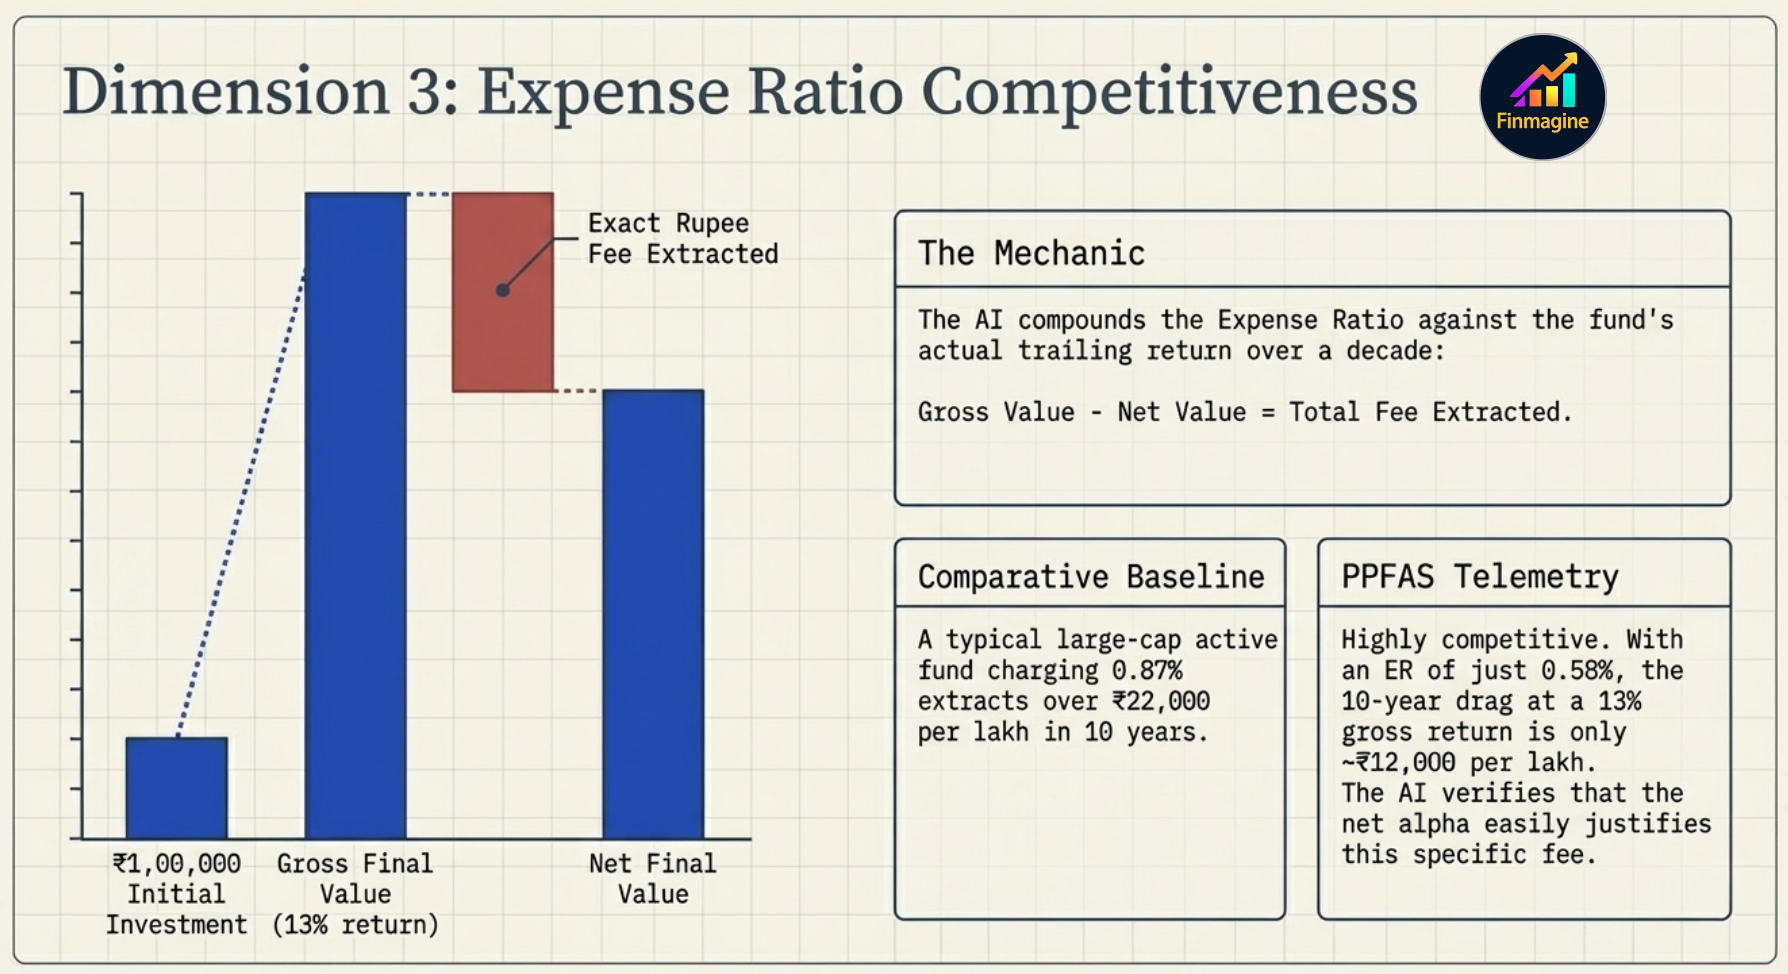
The silent wealth killer: a 0.87% ER extracts โ‚น23,000 from a โ‚น1 lakh investment over 10 years โ€” nearly 23% of original capital, compounded away in daily fee deductions.

The mutual fund industry has done a masterful job framing the expense ratio as a triviality. You see "0.87%" and your brain categorises it as less than 1% โ€” spare change. But this psychological abstraction conceals the destructive power of compound interest working in reverse. The Deep Analysis template shatters the illusion by translating the percentage into a concrete rupee figure:

โ‚น1,00,000 ร— (1.12)10 = โ‚น3,10,585  (at 12% gross return)
โ‚น1,00,000 ร— (1.1113)10 = โ‚น2,87,601  (at 11.13% net return after 0.87% ER)
Fee paid over 10 years: โ‚น22,984 โ€” nearly 23% of your starting capital

The AI then asks the brutal follow-up: does the alpha in Dimension 2 exceed this cost? If the manager generated โ‚น10,000 of excess return but the fund house extracted โ‚น23,000 in fees, the investor subsidised the fund manager's office while their own wealth was drained.
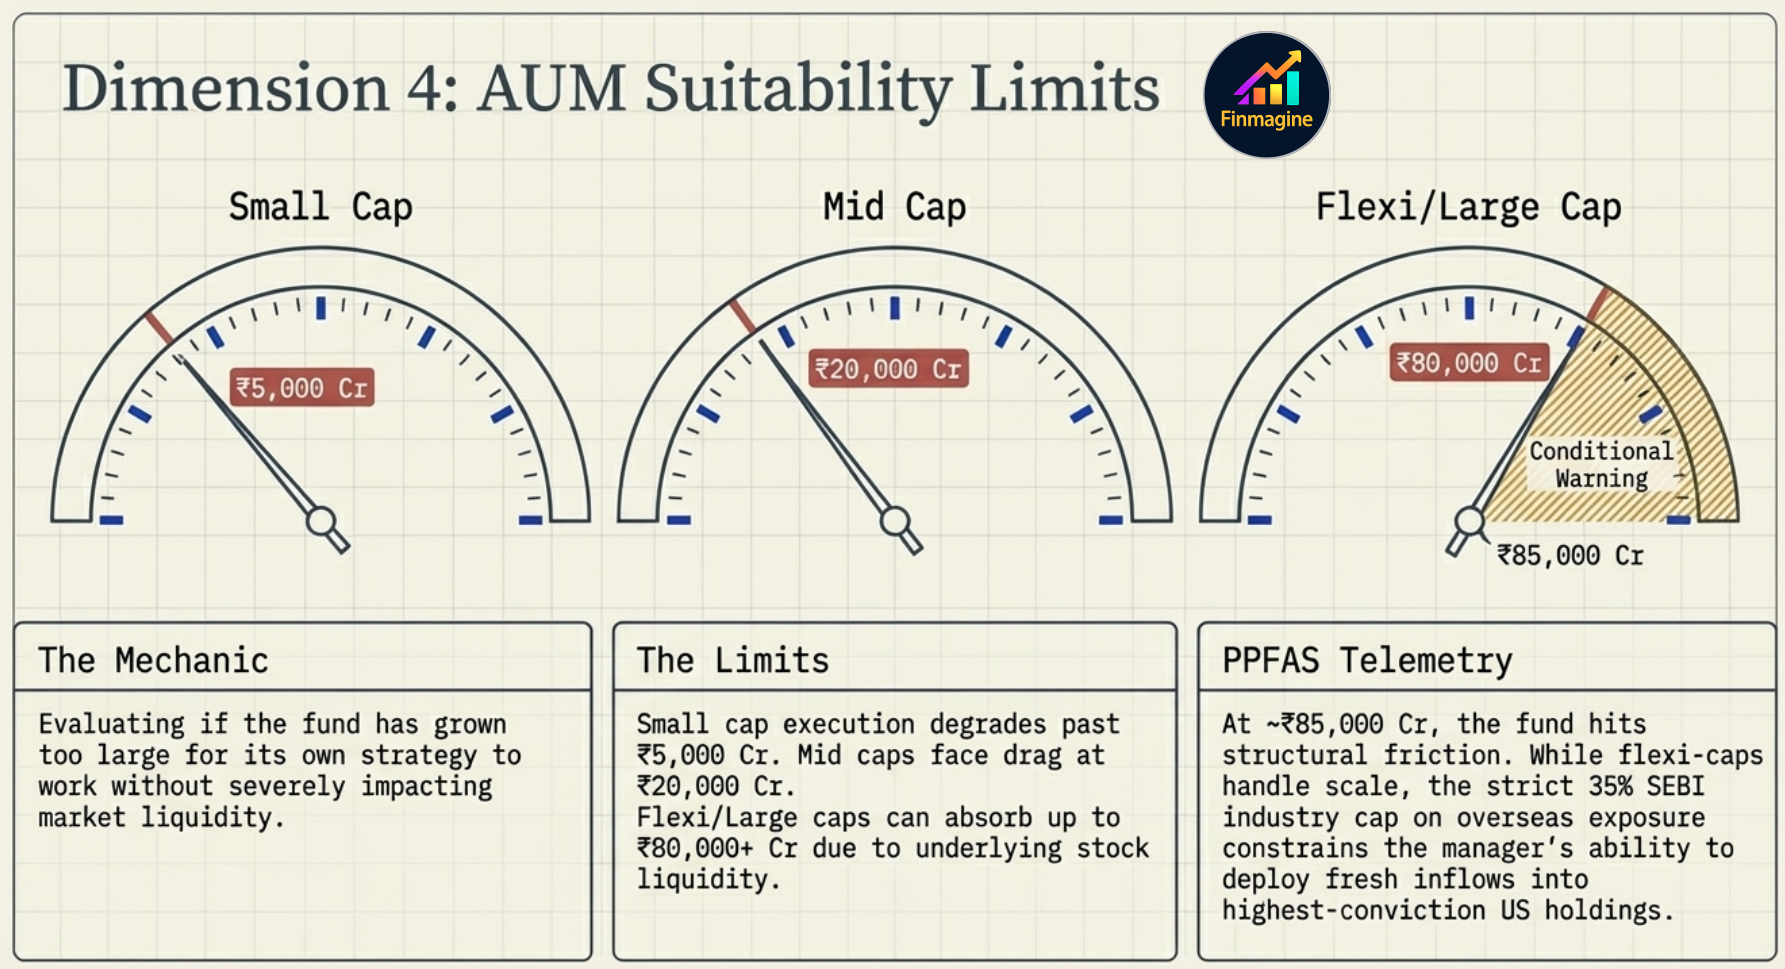
PPFAS Telemetry: PPFAS Direct charges just 0.58% โ€” one of the lowest ERs in the flexi cap category for a fund running active international currency trades. At 13% gross return, the 10-year drag drops to approximately โ‚น12,000 per lakh โ€” roughly half the ICICI Large Cap fund's โ‚น23,000 at 0.87%. Despite running a significantly more complex strategy, PPFAS is structurally cheaper to own. The AI flags this as a strong point in its favour.
Dimension 4
AUM Suitability
"Has the fund grown too large for its own strategy to work?"
Dimension 4: AUM Suitability Limits โ€” speedometer dials for small cap, mid cap, and flexi/large cap thresholds

Category-specific capacity thresholds โ€” PPFAS at โ‚น85,000 Cr sits in the conditional warning zone for flexi/large cap funds.

CategoryCapacity Concern ThresholdStructural Impact
Small Capโ‚น5,000 Cr+Market impact cost destroys trade economics; style drift into mid/large cap inevitable
Mid Capโ‚น20,000โ€“50,000 CrForced into large caps to deploy cash; mandate drift begins
Large Cap / Flexi Capโ‚น60,000โ€“80,000 Cr+Closet indexing risk โ€” only Nifty heavyweights are liquid enough to absorb inflows
Index Funds / ETFsNo practical limitPassive execution benefits from scale; AUM irrelevant
PPFAS Telemetry: At ~โ‚น85,000 Cr, PPFAS sits above the flexi cap concern zone. A pure domestic flexi cap could survive by rotating into liquid Nifty names. But PPFAS faces a unique legislative trap: SEBI's industry-wide cap on overseas remittances means the fund is constantly pressing against the 35% international ceiling. When โ‚น10,000 Cr of fresh retail money arrives, Thakkar cannot deploy it into Microsoft or Amazon โ€” the regulatory cap is already maxed. The AI flags this explicitly: the โ‚น85,000 Cr AUM is actively constraining optimal capital allocation, forcing a heavier domestic tilt on fresh inflows than the manager would choose.
Dimension 5
Portfolio Construction Quality
"Do the actual holdings reflect a coherent investment thesis consistent with the fund's mandate?"
Dimension 5: Portfolio Construction Quality โ€” treemap showing PPFAS holdings: domestic defensives + US tech

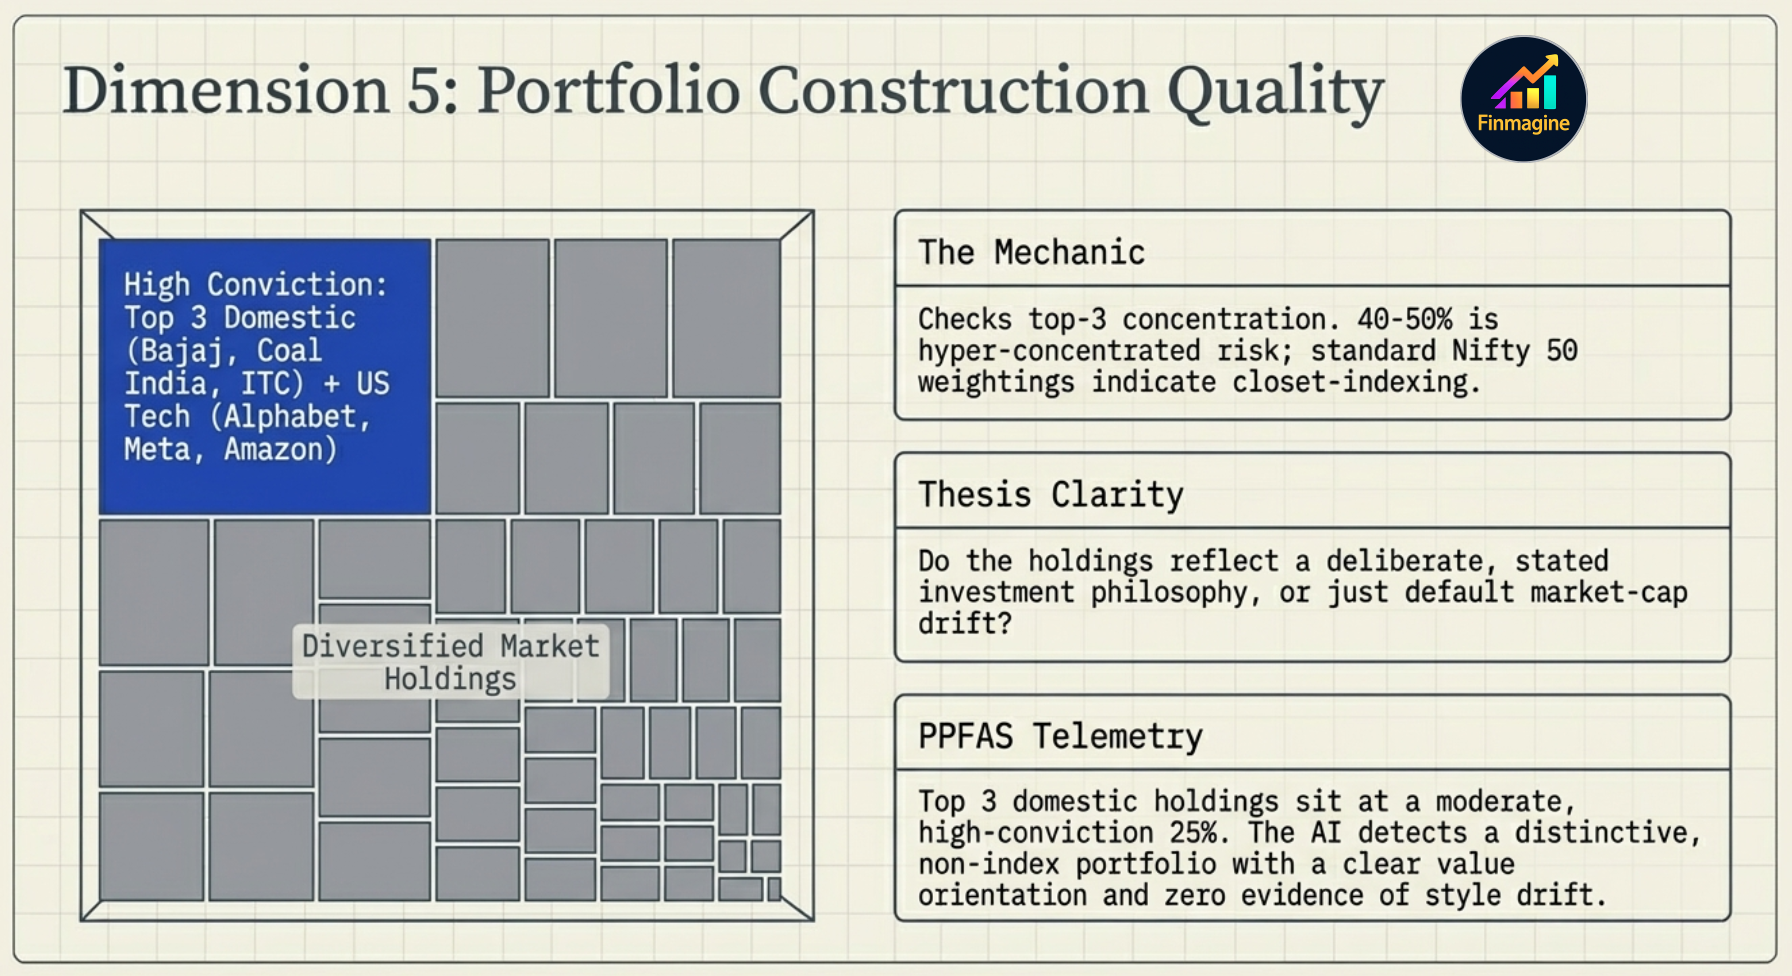
PPFAS's distinctive non-index portfolio โ€” domestic defensives (Bajaj, Coal India, ITC) alongside US tech giants (Alphabet, Meta, Amazon) โ€” signals a deliberate value-oriented barbell thesis, not closet indexing.

The AI does not read the fund's marketing materials. It reads the actual stock tickers and checks for three things:

  1. Mandate coherence: Does the asset allocation (equity/debt/cash %) match the category mandate? Does the market cap breakdown fit?
  2. Concentration: Top-3 holding weight between 25โ€“35% signals conviction without recklessness. Above 50% is hyper-concentration risk. Index-like holdings (top 10 = Nifty 50 heavyweights in market-cap order) signal closet indexing.
  3. Thesis clarity: Do the holdings tell a consistent story? A fund holding Coal India and Alphabet alongside each other looks bizarre โ€” until you recognise the barbell thesis: high-cashflow defensive value anchors + high-growth technology optionality. Coherent. Not random.
PPFAS Telemetry: The AI detects a distinctive, high-quality non-index portfolio. Top-3 concentration sits at a healthy ~25%. Holdings span Bajaj Holdings, Coal India, ITC (domestic value) and Alphabet, Amazon, Meta (international growth) โ€” a clear barbell value thesis. Zero evidence of closet indexing, zero style drift from the stated mandate. Portfolio construction quality is rated exceptional.
Dimension 6
Return Consistency vs Category
"Is the fund reliably in the top half of its category across periods, or does it rotate between quartiles?"
Dimension 6: Return Consistency vs Category โ€” quartile chart showing PPFAS erratic in 1Y/3Y but locked top-quartile in 5Y/10Y

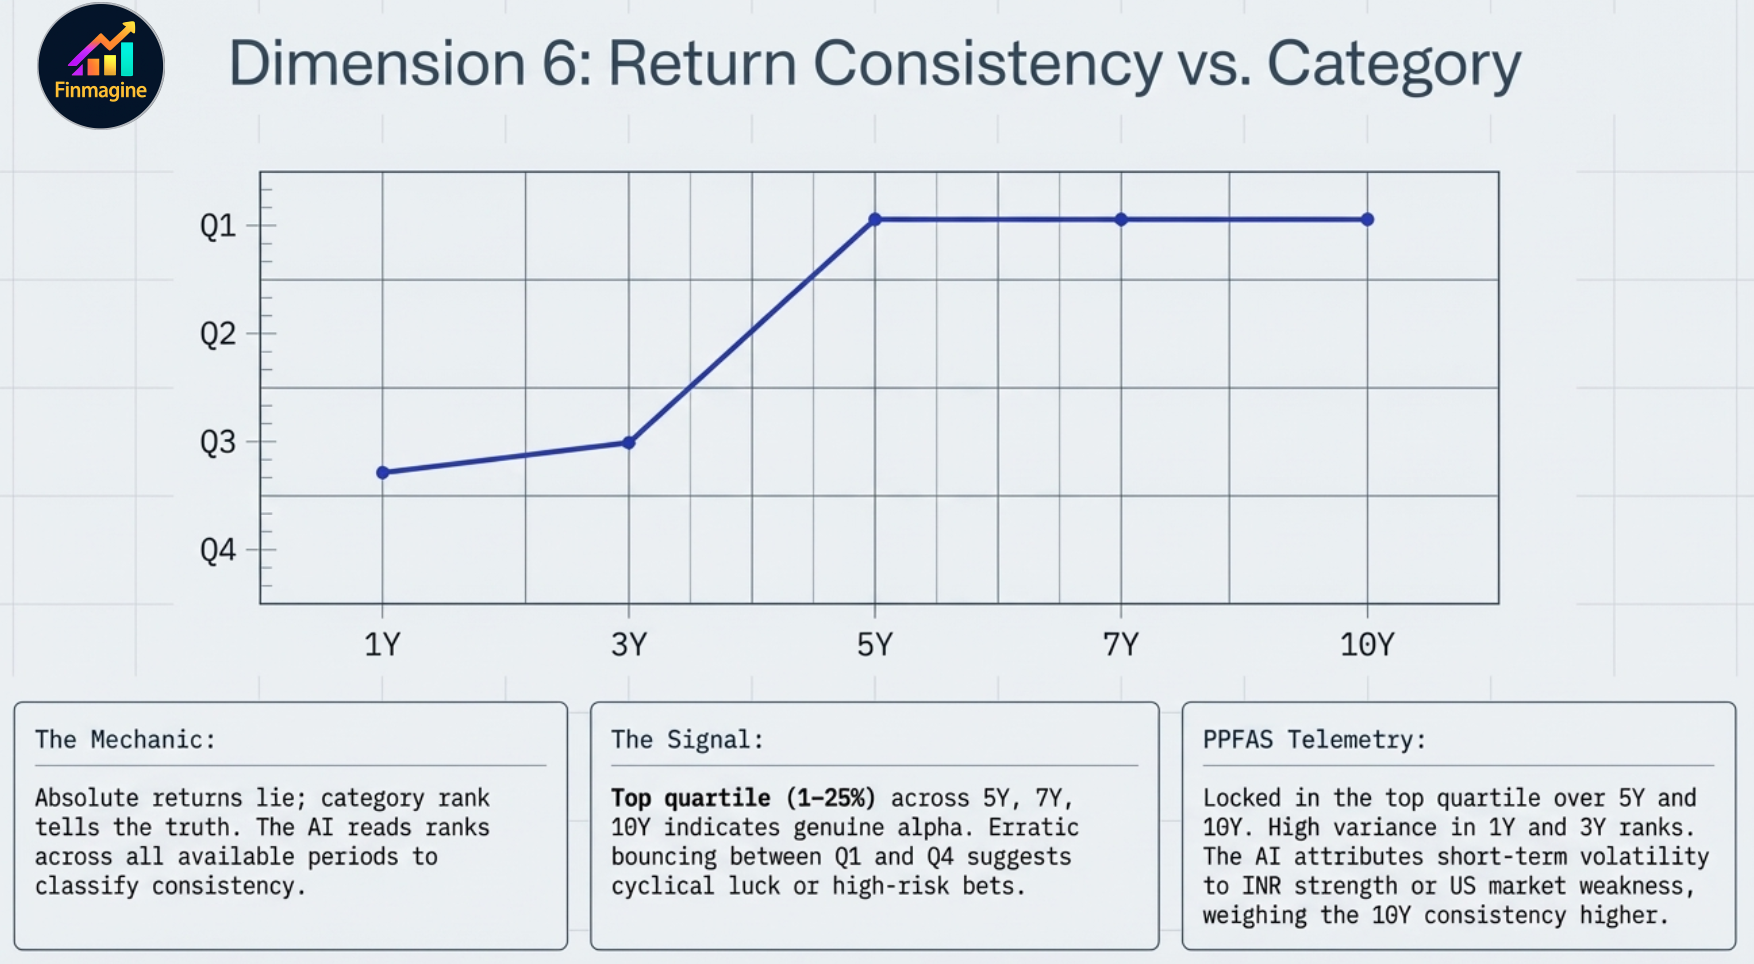
PPFAS's quartile journey: volatile in the short term (1Y, 3Y) due to INR/USD dynamics, but locked into the top quartile over 5Y and 10Y โ€” the AI reads this as structural, not a skill failure.

Absolute returns are a mirage created by macroeconomic tides. A rising tide lifts all boats. A completely incompetent fund manager can generate 15% in a year where the broad market surged 25% โ€” and that is a catastrophic failure, not a victory, masked by bull market momentum.

Category rank strips away the noise. The AI classifies consistency using quartile position across all available periods:

PatternInterpretation
Top quartile (rank โ‰ค 25%) across 5Y, 7Y, 10YGenuine consistent outperformer โ€” dynasty-level skill
Top half consistently but not always top quartileSolid, reliable โ€” not exceptional
Top quartile in one period, bottom half in othersCyclical or lucky โ€” not a repeatable system
Bottom quartile across most periodsChronic underperformer โ€” active fees unjustified
PPFAS Telemetry: Top quartile over 5Y and 10Y โ€” consistently crushing 75% of direct peer funds over a full decade. Short-term (1Y and 3Y) ranks are erratic. The AI does not penalise PPFAS for this โ€” it cross-references Dimension 1's international allocation analysis and concludes the short-term variability is a structural feature of holding 35% in USD assets, not evidence of deteriorating skill. When INR strengthens or US tech corrects, a pure domestic flexi cap fund will outperform PPFAS regardless of Thakkar's stock-picking quality. The AI refuses to punish the fund for the mathematics of currency translation.
Dimension 7
SEBI-Compliant Suitability Assessment
"Taking everything above into account, what is the explicit verdict for a general investor?"
Dimension 7: The SEBI-Compliant Verdict โ€” AI processing engine flowchart showing Suitable / Conditionally Suitable / Not Suitable

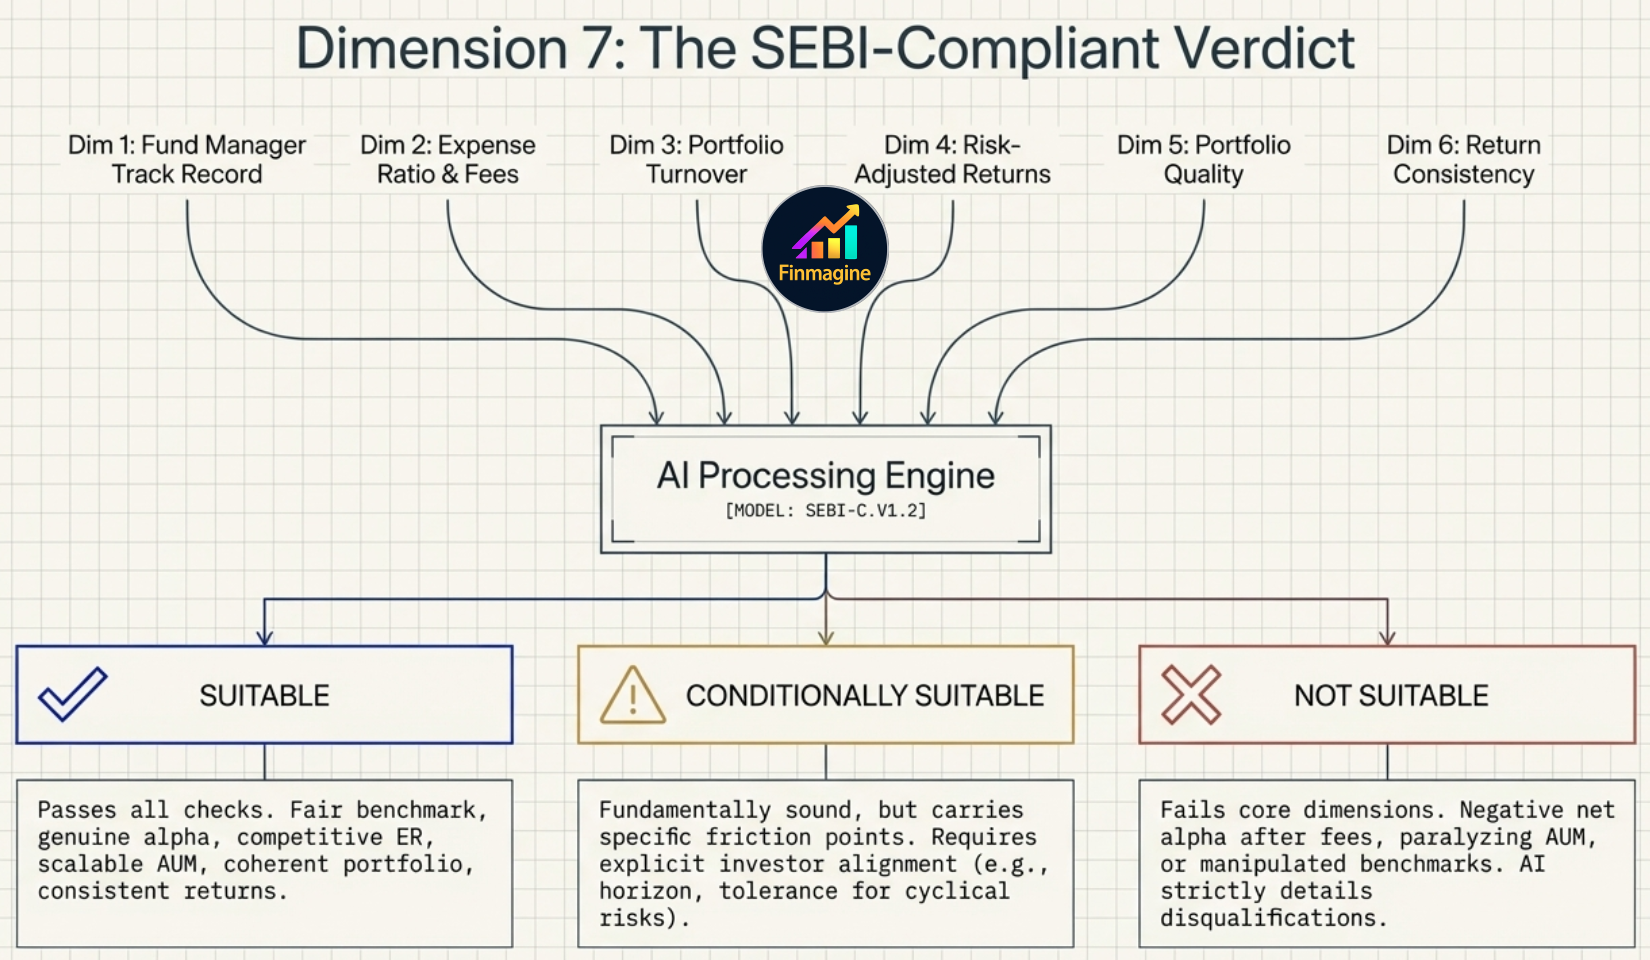
All 6 preceding dimensions feed into the AI processing engine to produce one of three SEBI-aligned verdicts โ€” no ambiguity, no brochure-speak.

The final dimension synthesises all six preceding analyses into one of three verdicts. The AI is explicitly instructed to never use generic broker terminology โ€” no "buy", no "sell", no "hold". The verdicts are diagnostic, not prescriptive:

โœ… SUITABLE

The fund passes most or all dimensions. Benchmark is fair (TRI), alpha is genuine and consistent, expense ratio is competitive, AUM does not impair the strategy, portfolio is well-constructed with a clear thesis, returns are consistently top-quartile. Appropriate for investors matching the fund's stated risk profile and minimum time horizon.

โš ๏ธ CONDITIONALLY SUITABLE

The fund is fundamentally sound but carries specific friction points. The verdict includes explicit conditions โ€” e.g. "Suitable only for investors with a 7+ year horizon who accept that the 35% international allocation will cause 1โ€“3 year underperformance vs India-only peers during periods of INR strength or US market correction." Conditions are stated, not implied.

โŒ NOT SUITABLE

The fund fails on enough dimensions โ€” negative net alpha after fees, AUM-paralysed strategy, manipulated PRI benchmark, or chronic quartile underperformance. The AI provides a mathematical autopsy: which dimensions failed, with specific numbers cited as evidence. It refuses to use vague language; every disqualification is traceable to data in the prompt.

The PPFAS Case Study: Final Verdict

Case Study Output: PPFAS Flexi Cap Fund โ€” Conditionally Suitable verdict with explicit conditions

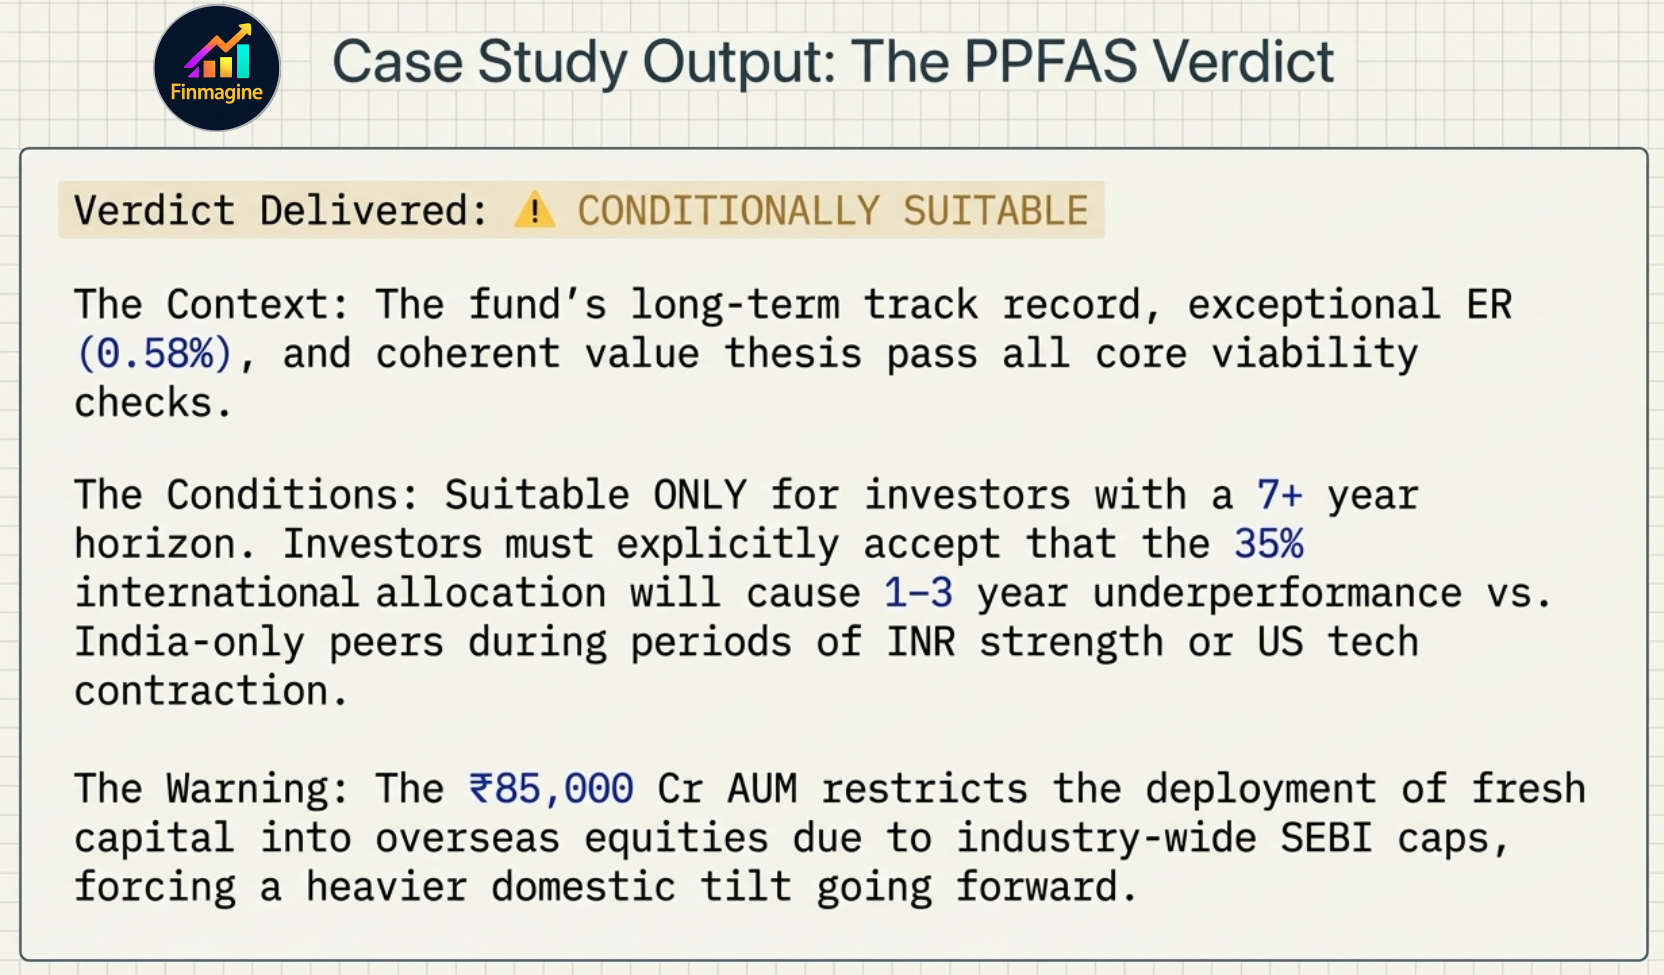
The AI's verdict on one of India's most celebrated funds: Conditionally Suitable โ€” not because it is a bad fund, but because its success is mathematically beginning to constrain its future potential.

After synthesising all 7 dimensions, the AI delivers a verdict of Conditionally Suitable for PPFAS Flexi Cap Fund โ€” Direct Plan. This is not a failure verdict. It is precisely the kind of nuanced, conditions-bearing output that separates a forensic analysis from a marketing brochure.

The conditions attached are explicit:

  1. Minimum 7-year time horizon required โ€” the short-term international allocation volatility makes this unsuitable for investors with shorter horizons
  2. Accept cyclical underperformance โ€” the fund will experience 1โ€“3 year periods of significant underperformance versus pure Indian flexi cap peers whenever INR strengthens or US tech corrects. An investor who panic-sells during these windows will crystalise losses on a fund that was simply doing what its mandate requires
  3. Accept the AUM capacity ceiling โ€” the era of explosive mid-cap alpha from PPFAS is structurally over. Future returns will be anchored more heavily by large-cap domestic stability and the constrained international allocation. Accept the mature fund, not the scrappy startup that built the original track record
๐Ÿ“Œ The paradox of success: PPFAS has a brilliant manager, an exceptionally low expense ratio, a unique investment thesis, and a verified 10-year track record. It is the gold standard of Indian active fund management. And yet the cold logic of the 7-dimension audit grants it only "Conditionally Suitable" โ€” because its own massive success is mathematically beginning to constrain its future potential. Capital becomes a prison. If a fund this good is granted only a conditional verdict, what does that say about the hundreds of funds that cannot match even a fraction of its quality profile?

Quick Reference: The Dimension Master Matrix
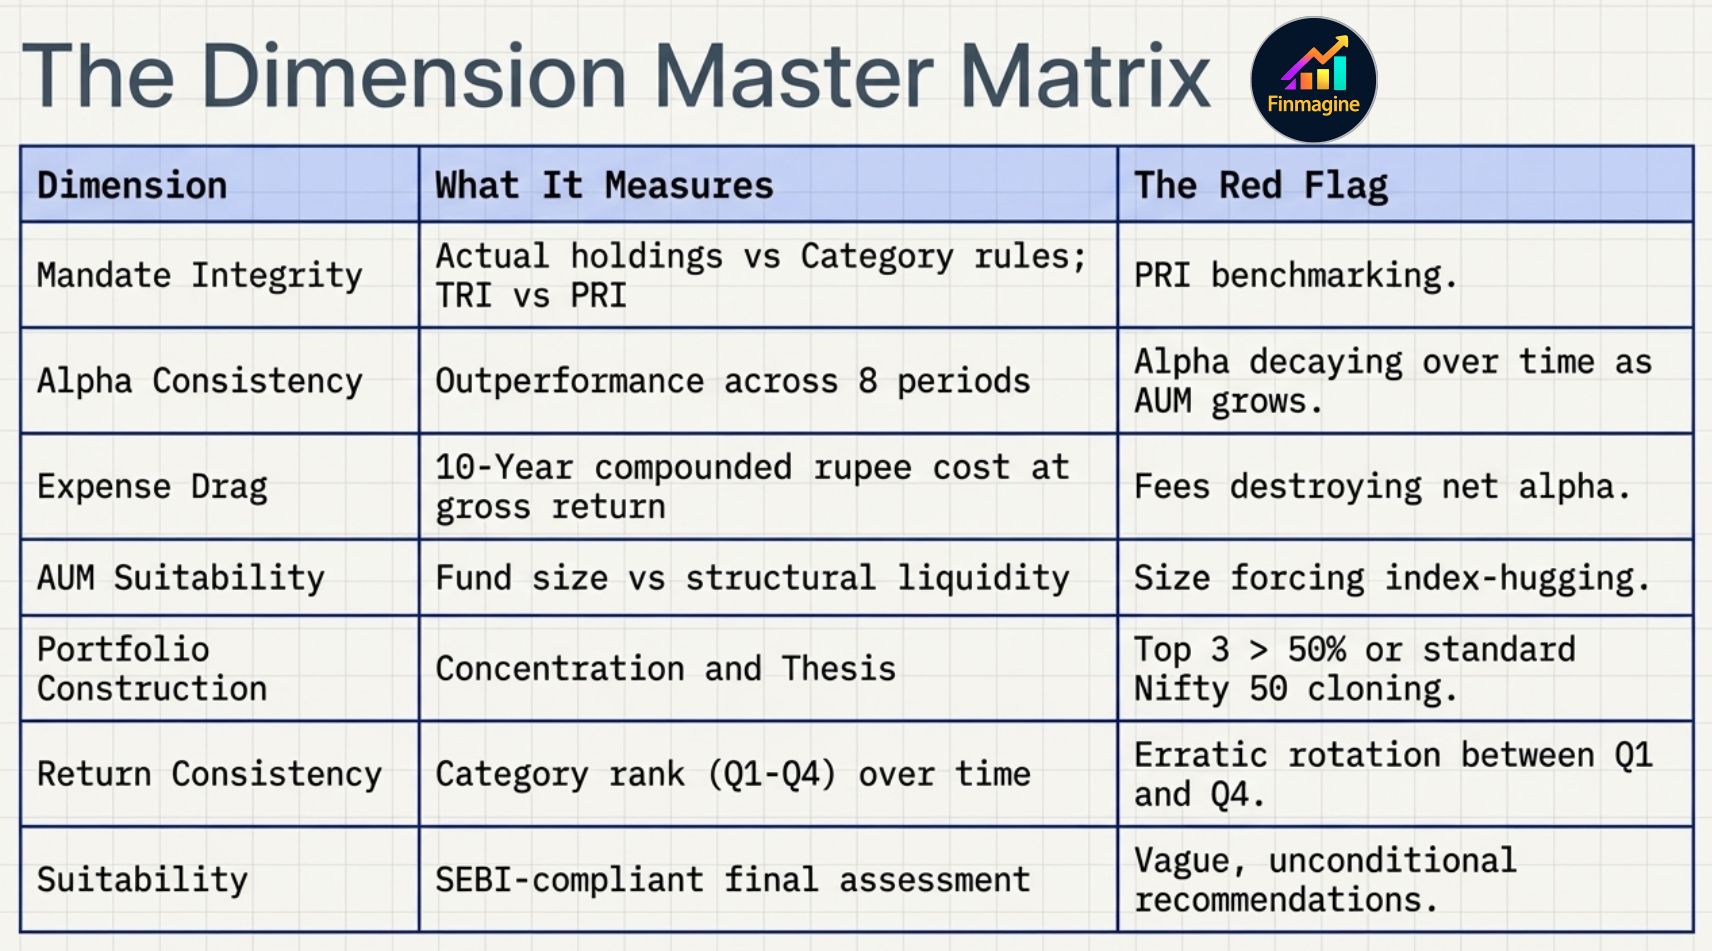
The Dimension Master Matrix โ€” all 7 dimensions with what each measures and the red flag for each

Save this reference table โ€” what each dimension measures, and the red flag that triggers a negative assessment.

DimensionWhat It MeasuresThe Red Flag
1. Mandate IntegrityActual holdings vs category rules; TRI vs PRI benchmarkPRI benchmarking; holdings outside stated category
2. Alpha ConsistencyOutperformance across all 8 periodsAlpha decaying over time as AUM grows (compression wedge)
3. Expense Drag10-year compounded rupee cost at gross returnFees destroying net alpha โ€” investor subsidising the fund house
4. AUM SuitabilityFund size vs structural liquidity of the mandateSize forcing index-hugging; international cap hit for hybrid funds
5. Portfolio ConstructionConcentration and thesis clarityTop 3 > 50% or standard Nifty 50 cloning (closet indexing)
6. Return ConsistencyCategory rank (Q1โ€“Q4) over timeErratic rotation between Q1 and Q4; bottom quartile across periods
7. Suitability VerdictSEBI-compliant final assessmentVague, unconditional recommendation โ€” the AI must cite specific numbers

Guardrails: Defeating Brochure Speak

Guardrails: Defeating Brochure Speak โ€” reject fluffy output, use the override protocol

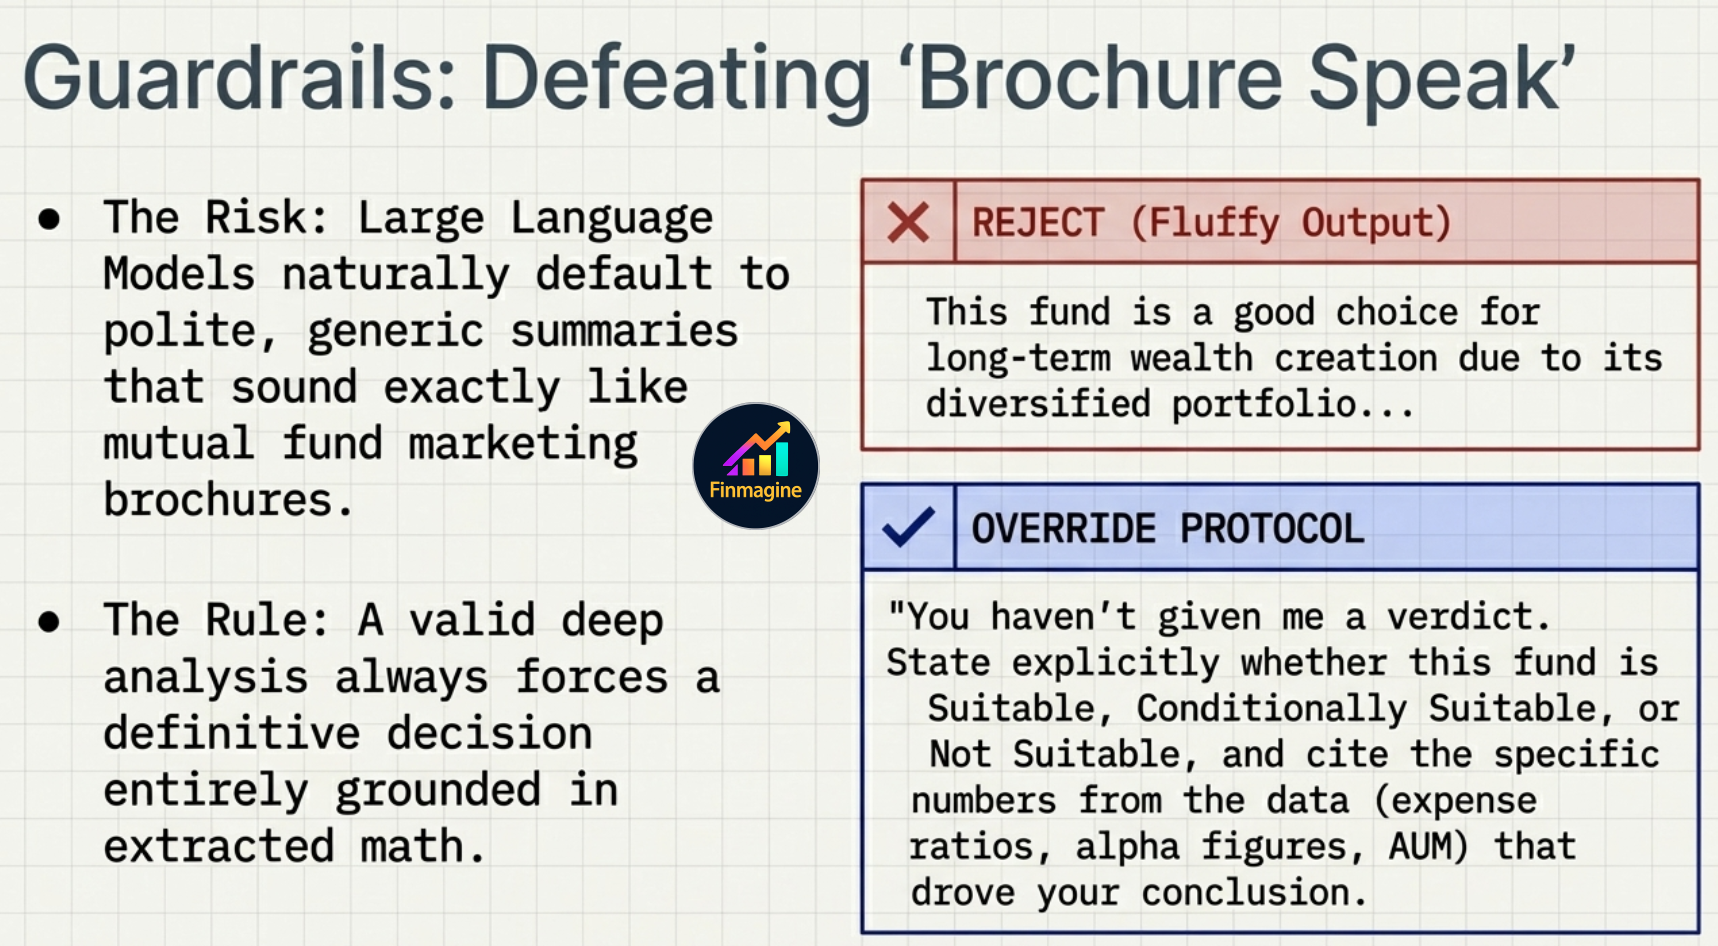
If the AI output sounds like a marketing brochure, use the override protocol โ€” force a verdict with specific numbers.

Large language models are trained on the internet โ€” which is saturated with glossy fund marketing materials. Their natural instinct is to default to the most common tone: polite, non-committal, and exactly as useful as the fund fact sheet you were trying to escape.

โš ๏ธ Reject this output: "This is a well-managed fund with a robust long-term track record and a strong management team. Given its diversified portfolio and competitive expense ratio, it appears to be a solid choice for long-term wealth creation."

That is zero analytical value dressed as an expert opinion. It contains no numbers, no verdict, and no conditions.
๐Ÿ’ก Override protocol โ€” use this exact push-back:
"You haven't given me a verdict. State explicitly whether this fund is Suitable, Conditionally Suitable, or Not Suitable, and cite the specific numbers from the data โ€” expense ratios, alpha figures, AUM thresholds, quartile ranks โ€” that drove your conclusion. I need math, not adjectives."

A high-quality AI response to the Deep Analysis prompt looks like this: a clear stated verdict, specific extracted numbers supporting each claim (e.g. "10-year drag is โ‚น12,000 per lakh at 13% CAGR"), and falsifiable conditions attached to the verdict ("recommendation is conditioned on the fund manager remaining unchanged and AUM not exceeding โ‚น1,00,000 Cr"). If you do not get this, push back until you do.

Which AI to use: Claude is the top recommendation for Deep Analysis โ€” unmatched at complex multi-dimensional reasoning, strict fee arithmetic, and delivering conditioned verdicts without fluff. ChatGPT is a strong alternate for Deep Analysis and Portfolio Fit. Gemini Deep Research is explicitly not recommended โ€” its architecture compels it to search the web, corrupting the clean structured dataset the panel assembled.

Next in the Series

Run Your First Deep Analysis

Install Finmagine AI Advisor, open any mutual fund on Value Research Online, and generate a 7-dimension deep analysis in seconds. The SEBI suitability verdict is one click away.

Get Finmagine AI Advisor →

Free Chrome Extension

Ready to try this yourself?

Install the Finmagine AI Advisor and generate institutional-grade research prompts from any Screener.in or stockanalysis.com company page in seconds.

Install from Chrome Web Store →

No account required • Works on Chrome, Edge, Brave, Opera

Join Finmagine WhatsApp Community