Following along? Open the live page
Finmagine — free to explore • premium for full access • no app needed
After reading this guide you will be able to:
- Understand which investor archetype each of the three frameworks is designed for
- Read the CAN SLIM checklist's 10 criteria and understand each threshold
- Read the Quality + Value checklist's 9 criteria and their Buffett-style logic
- Read the Dividend Growth checklist's 6 criteria for income-oriented investing
- Use the pass rate as a framework fit indicator — not a buy/sell signal
- Know which framework to weight more for your own investment style
1. What the Checklists Tab Does
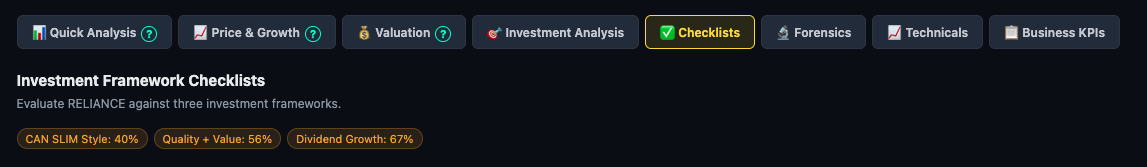
The Checklists sub-tab takes three well-known investment frameworks and automatically scores any NSE stock against them using live financial data. No manual calculation needed — every criterion is checked against the company's actual numbers and marked pass or fail.
Each chip shows a percentage pass rate and the count of criteria passed. The higher the score, the better the stock fits that particular investment philosophy.
2. CAN SLIM Style — Momentum Growth Framework
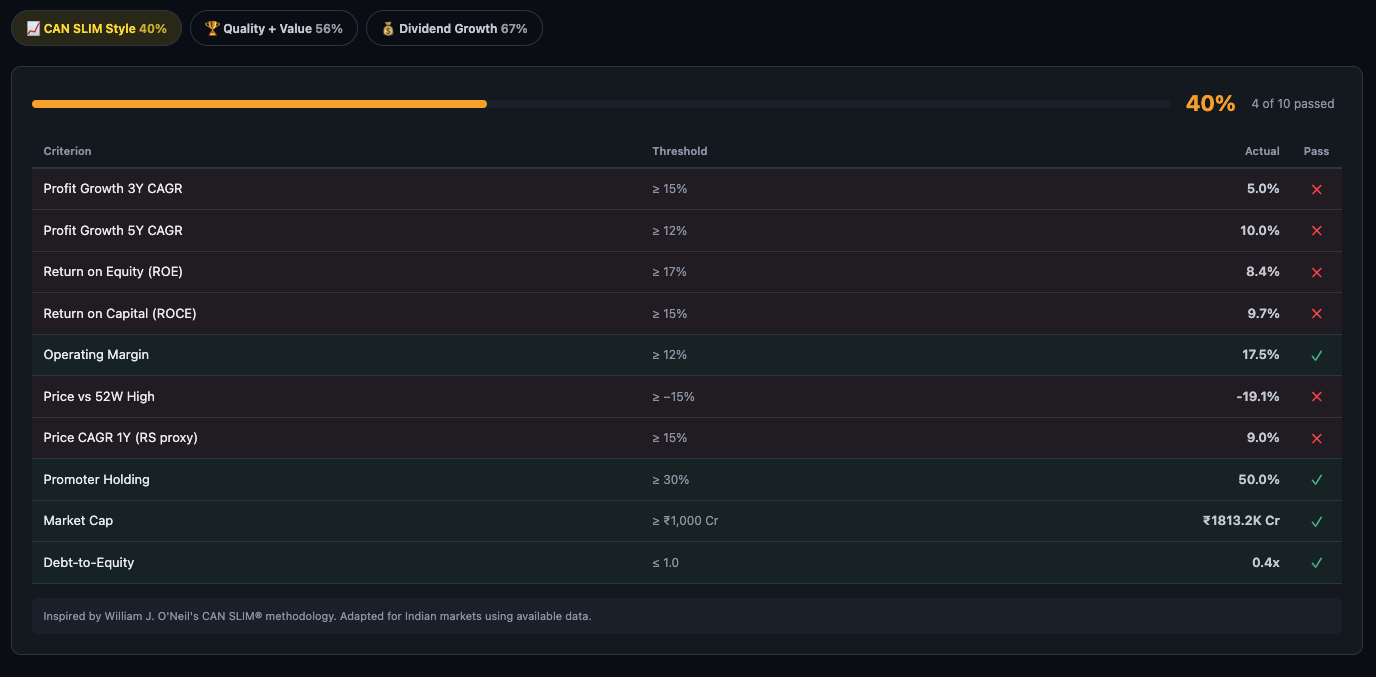
Inspired by William J. O'Neil's CAN SLIM® methodology, adapted for Indian markets using available financial data. CAN SLIM was designed to identify high-growth stocks setting up for price breakouts — it is a framework for growth-momentum investors, not value or income investors.
The 10 Criteria
| Criterion | Threshold | What It Tests |
|---|---|---|
| Profit Growth 3Y CAGR | ≥ 15% | Recent earnings acceleration — the "C" in CAN SLIM (Current Earnings) |
| Profit Growth 5Y CAGR | ≥ 12% | Sustained earnings growth track record — the "A" (Annual Earnings) |
| Return on Equity (ROE) | ≥ 17% | Management effectiveness at generating returns — high bar (O'Neil's original) |
| Return on Capital (ROCE) | ≥ 15% | Capital efficiency across the whole business (debt + equity) |
| Operating Margin | ≥ 12% | Business quality and pricing power |
| Price vs 52W High | ≥ −15% | Stock must be near its annual high — CAN SLIM buys near highs, not bottoms |
| Price CAGR 1Y (RS proxy) | ≥ 15% | Relative strength — the stock must be outperforming the market in the past year |
| Promoter Holding | ≥ 30% | Institutional/insider ownership conviction |
| Market Cap | ≥ ₹1,000 Cr | Minimum liquidity — avoids illiquid micro-caps |
| Debt-to-Equity | ≤ 1.0 | Reasonable leverage — growth should be funded by earnings, not debt |
3. Quality + Value — Buffett-Style Compounder Framework
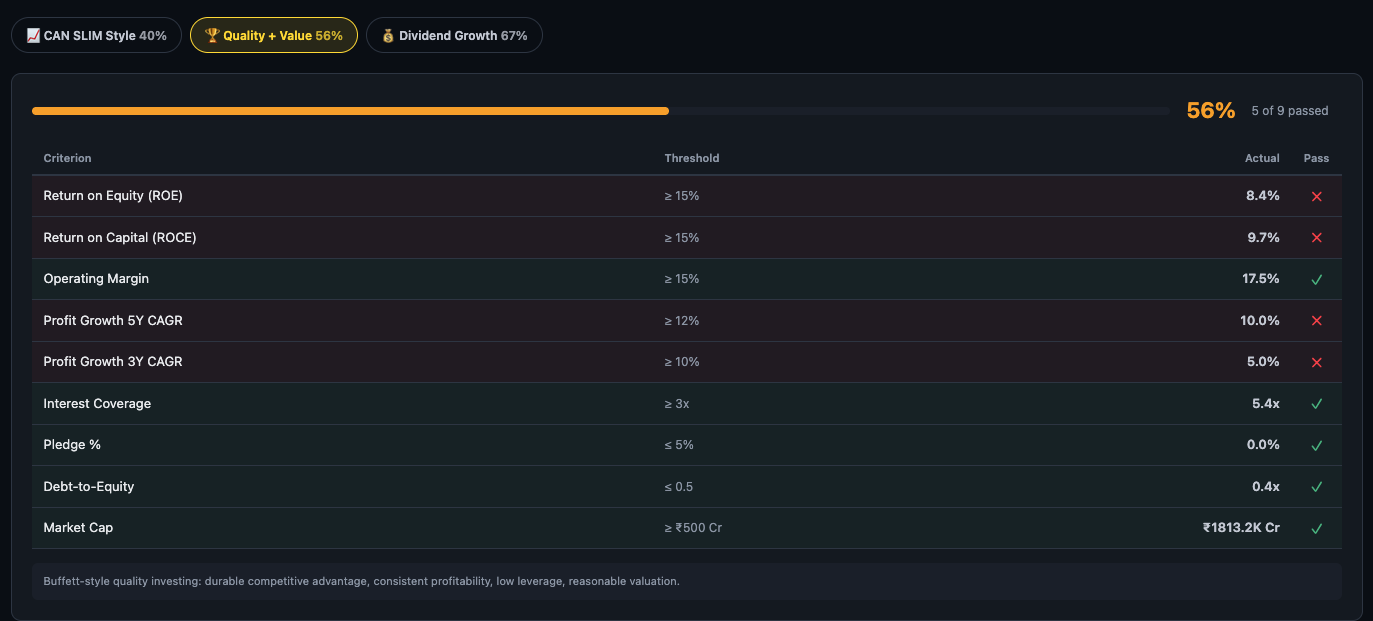
A Buffett-style quality investing framework: durable competitive advantage, consistent profitability, low leverage, and reasonable valuation. Designed for investors who hold companies for years, not months. Stricter on profitability thresholds than CAN SLIM, but relaxed on price momentum (no price criteria at all).
The 9 Criteria
| Criterion | Threshold | What It Tests |
|---|---|---|
| Return on Equity (ROE) | ≥ 15% | Sustainable returns to shareholders — the hallmark of a quality business |
| Return on Capital (ROCE) | ≥ 15% | Full capital efficiency — excludes businesses that generate ROE via leverage tricks |
| Operating Margin | ≥ 15% | Structural pricing power — thin-margin businesses rarely compound well |
| Profit Growth 5Y CAGR | ≥ 12% | Long-term earnings compounding track record |
| Profit Growth 3Y CAGR | ≥ 10% | Recent earnings consistency — slightly lower bar than 5Y to allow for near-term cycles |
| Interest Coverage | ≥ 3x | Debt safety margin — business can cover interest 3× over even in a down year |
| Pledge % | ≤ 5% | Governance check — any significant pledging is a red flag for long-term holders |
| Debt-to-Equity | ≤ 0.5 | Conservative balance sheet — stricter than CAN SLIM, true Buffett-style standard |
| Market Cap | ≥ ₹500 Cr | Minimum scale and liquidity — below this, compounding is harder and governance weaker |
4. Dividend Growth — Income & Stability Framework
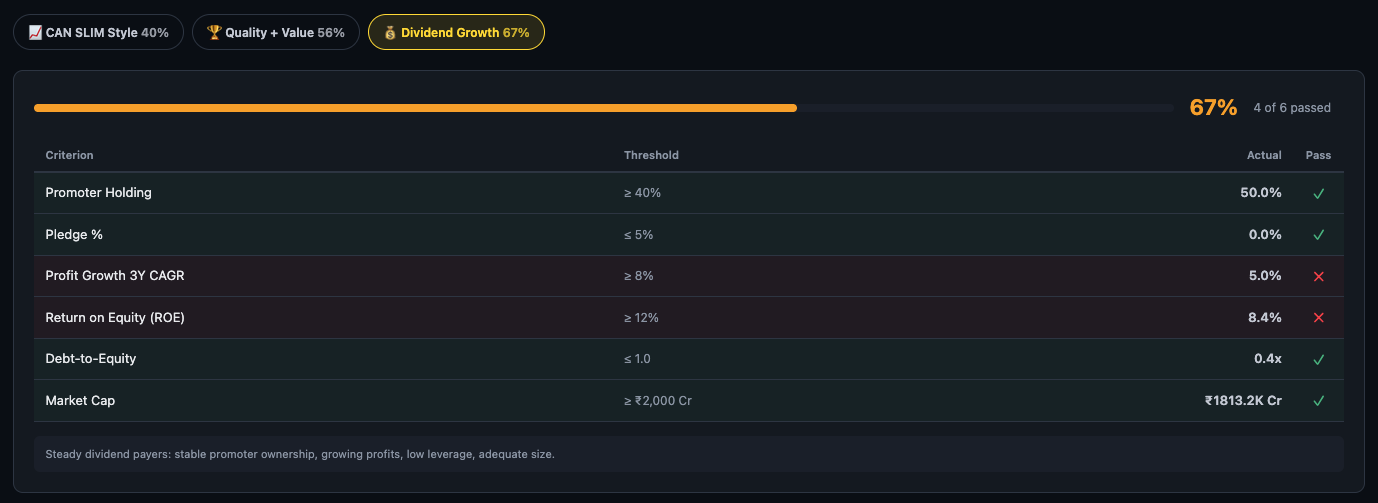
Designed for income-oriented investors who prioritise stable, growing dividend payers over capital growth. The framework focuses on stability indicators — promoter conviction, governance, earnings growth for dividend sustainability, and balance sheet strength. It has the fewest criteria (6) but each carries high conviction.
The 6 Criteria
| Criterion | Threshold | What It Tests |
|---|---|---|
| Promoter Holding | ≥ 40% | High promoter ownership signals skin-in-the-game — promoters with large stakes have incentive to pay dividends |
| Pledge % | ≤ 5% | Governance cleanliness — pledged promoter shares create risk of forced selling that disrupts dividend policy |
| Profit Growth 3Y CAGR | ≥ 8% | Earnings must grow at least modestly to sustain and grow dividends over time |
| Return on Equity (ROE) | ≥ 12% | Business must generate decent returns to have surplus cash available for dividends |
| Debt-to-Equity | ≤ 1.0 | Low debt ensures interest payments don't crowd out dividend capacity |
| Market Cap | ≥ ₹2,000 Cr | Stricter size requirement — small companies have volatile cash flows; large caps sustain dividends better through cycles |
5. How to Use the Checklists in Practice
Match the Framework to Your Investment Style
| If you are… | Weight this framework | Ignore or de-weight |
|---|---|---|
| A momentum-growth investor (6–18 month horizon) | CAN SLIM Style | Dividend Growth (not relevant for your style) |
| A long-term compounder investor (3–10 year horizon) | Quality + Value | CAN SLIM (price momentum criteria not relevant) |
| An income investor focused on dividends | Dividend Growth | CAN SLIM (growth bar too high for mature dividend payers) |
| A balanced investor | Quality + Value primary, Dividend Growth secondary | CAN SLIM unless also momentum-oriented |
Reading the Criterion Table
- Step 1 Switch to your relevant framework tab (CAN SLIM / Quality + Value / Dividend Growth).
- Step 2 Note the overall pass rate — this is your quick framework fit score.
- Step 3 Scan the (fail) rows — these are specific weaknesses. Note how far below threshold the actual value is.
- Step 4 For each fail, decide: is this structural (unlikely to improve) or cyclical (likely to recover)? A 3Y CAGR fail in a down-cycle year is different from a permanent ROE problem.
- Step 5 Cross-reference fails with the Investment Analysis sub-tab's Risk Factors — if the same metric appears in both places, it is a confirmed weakness, not a borderline case.
Common Patterns to Watch
| Pattern | What It Means | What to Check Next |
|---|---|---|
| High Quality + Value, Low CAN SLIM | Great business, low momentum — may be in a slow phase or out of favour | Check Valuation tab P/E Percentile Zone — if "Attractive" it may be a patient accumulation candidate |
| High CAN SLIM, Low Quality + Value | Strong momentum but questionable business quality — typical of cyclical upcycles | Check Quick Analysis tab for trend signals and Forensics for red flags before chasing momentum |
| High Dividend Growth, failing only ROE | Stable, clean company but returns are modest — typical of utilities, infrastructure | Check if Dividend Payout % and Dividend Yield justify holding for income despite low ROE |
| All three frameworks below 50% | Stock does not fit any standard investment framework well at current metrics | Go to Investment Analysis for the overall Ratio Score — the business may still warrant a HOLD if risk is low |
Ready to Analyse Indian Stocks Like a Pro?
Finmagine gives you 30+ computed financial ratios, sector benchmarks, FII/DII flows, the Finmagine Score, and AI-powered analysis — all in one place.