Following along? Open the live page
Finmagine — free to explore • premium for full access • no app needed
After reading this guide you will be able to:
- Understand how the BUY / HOLD / SELL verdict is derived from 30 ratio classifications
- Read the 3-Year Bear / Base / Bull price targets and understand the methodology behind them
- Distinguish between Key Catalysts (structural strengths) and Risk Factors (red flags)
- Use the P/E Percentile Zone to judge whether the current PE is historically cheap or expensive
- Read the Financial Health Snapshot's 8 metrics and their quality tags at a glance
- Combine all five sections into a coherent investment view on the stock
1. What Investment Analysis Does
While the Valuation sub-tab answers "Is the price cheap or expensive?", the Investment Analysis sub-tab answers a different question: "Is the business good enough to own?" It synthesises 30 ratio classifications into five connected sections:
- Investment Recommendation — a BUY / HOLD / SELL verdict with a ratio score out of 10, investment horizon, and risk level
- 3-Year Price Targets — Bear / Base / Bull scenarios showing projected 3-year prices and implied CAGR
- Key Catalysts & Risk Factors — specific ratios that are either excellent strengths or active red flags
- P/E Percentile Zone — where the current PE sits relative to the company's own historical annual readings
- Financial Health Snapshot — 8 key metrics each rated Excellent / Good / Average / Poor
2. Investment Recommendation
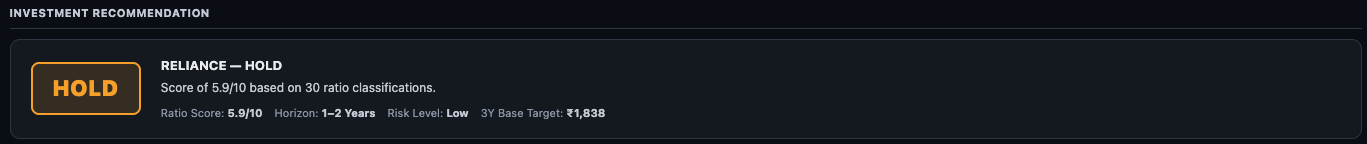
The Recommendation card gives you five pieces of information simultaneously:
How the Verdict Is Determined
Each of the 30 ratios in the Ratios tab is classified as Excellent, Good, Average, or Poor. These classifications are mapped to a numeric score and averaged to produce the overall Ratio Score out of 10. The verdict thresholds are:
| Score Range | Verdict | What It Means |
|---|---|---|
| 7.0 – 10.0 | BUY | Strong majority of ratios classified as Good or Excellent |
| 4.5 – 6.9 | HOLD | Mixed ratio profile — strengths and weaknesses coexist |
| 0 – 4.4 | SELL | Most ratios classified as Average or Poor — structural concerns |
Horizon and Risk Level
Horizon is the suggested holding period implied by the current score and risk level. A borderline HOLD suggests reviewing sooner (1–2 years); a high-conviction BUY with low risk may suggest 3+ years.
Risk Level is derived from financial leverage (D/E ratio, interest coverage) and earnings volatility. Low = conservative balance sheet. High = significant leverage or cyclical earnings.
3. 3-Year Price Targets — Bear / Base / Bull
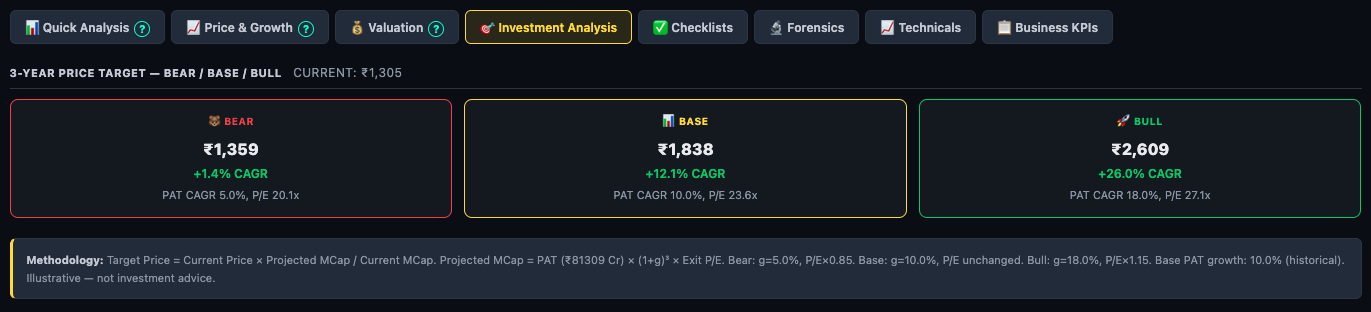
The Methodology
The formula is: Target Price = Current Price × (Projected MCap ÷ Current MCap)
Where Projected MCap = PAT × (1 + g)³ × Exit PE
| Scenario | PAT Growth (g) | Exit PE | Basis |
|---|---|---|---|
| Bear | 5.0% | Current PE × 0.85 | Conservative — slow growth + slight de-rating |
| Base | Historical PAT CAGR | Current PE unchanged | Continuation of recent trend, no re-rating |
| Bull | 15.0% | Current PE × 1.15 | Accelerating growth + mild PE re-rating |
4. Key Catalysts & Risk Factors
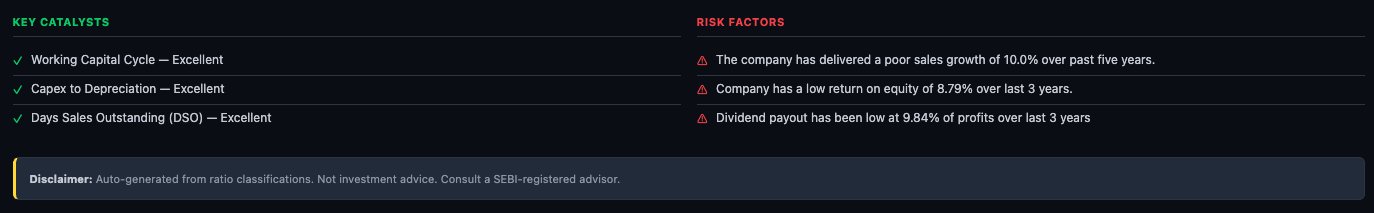
How These Are Derived
Key Catalysts are ratios that have been classified as Excellent in the Ratios tab. Only the highest tier qualifies — Good, Average, and Poor ratings are excluded. Each catalyst represents a structural advantage the business currently has.
Risk Factors are ratios classified as Poor — active weaknesses that are below acceptable thresholds and drag the Ratio Score down.
5. P/E Percentile Zone
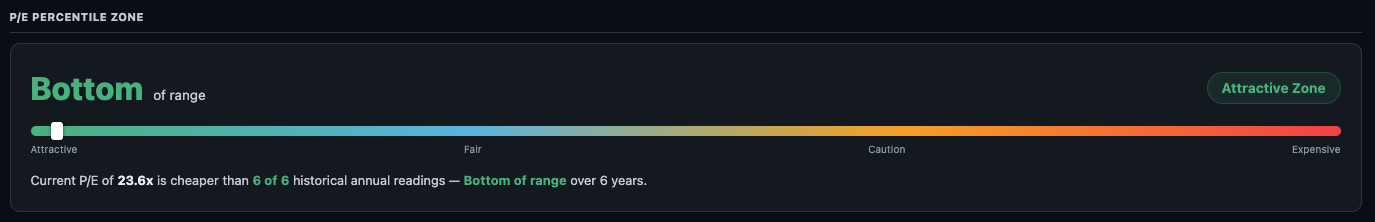
The P/E Percentile Zone places the current PE on a colour-coded spectrum showing where it sits relative to the company's own historical annual PE readings:
The label and zone tell you how many years of historical PE data the current reading beats:
| Label | Zone | What It Means |
|---|---|---|
| Bottom of range | Attractive | Current PE cheaper than all (or nearly all) historical readings |
| Below median | Attractive / Fair | Current PE cheaper than more than half of historical readings |
| Near median | Fair | Current PE near the historical midpoint |
| Above median | Caution / Expensive | Current PE higher than most historical readings |
| Top of range | Expensive | Current PE at or near its historical peak |
6. Financial Health Snapshot
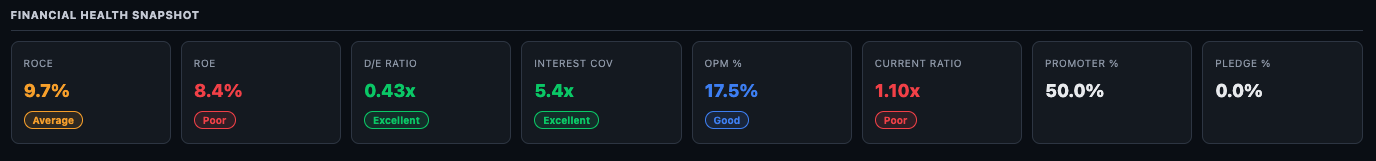
What Each Metric Tells You
| Metric | What It Measures | Watch Out For |
|---|---|---|
| ROCE | Return on capital employed — how efficiently the business uses all its capital (debt + equity) | Consistently below 12–15% signals poor capital allocation or a moat-free business |
| ROE | Return on equity — profit generated per rupee of shareholders' equity | Low ROE despite low debt means the core business is not earning enough |
| D/E Ratio | Debt relative to equity — financial leverage | Above 1.0x in cyclical sectors is a red flag; for capital-light businesses even 0.5x warrants scrutiny |
| Interest Coverage | EBIT ÷ Interest expense — how many times the company can cover its interest from operations | Below 2.0x leaves very little margin if earnings fall — vulnerable to rate cycles |
| OPM % | Operating profit margin — how much of each rupee of revenue survives to EBIT | Declining OPM trend (even with stable absolute numbers) signals pricing power erosion |
| Current Ratio | Current assets ÷ Current liabilities — short-term liquidity | Below 1.0x means the company owes more in the short term than it holds — potential working capital stress |
| Promoter % | Promoter ownership stake | Very low promoter holding (<30%) can mean low conviction; very high (>75%) limits float and liquidity |
| Pledge % | % of promoter holding pledged as collateral for loans | Any pledge above 0% is a risk — a sharp price fall can trigger forced selling by lenders |
7. How to Read Investment Analysis in the Right Order
The five sections work best read in sequence — from verdict, to targets, to specifics, to valuation context, to health check:
- Step 1 Investment Recommendation — note the verdict (BUY/HOLD/SELL), the ratio score, and the risk level. This sets the quality context.
- Step 2 3-Year Price Targets — check if the Base CAGR exceeds your hurdle rate. If the Bear scenario CAGR is still positive, downside is limited.
- Step 3 Key Catalysts — these are the specific strengths working for you. Understand what they mean for the business.
- Step 4 Risk Factors — these are the specific weaknesses working against you. Decide if they are structural or cyclical.
- Step 5 P/E Percentile Zone — if the business is reasonable quality (HOLD+) and the PE is "Bottom of range", entry timing may be favourable.
- Step 6 Financial Health Snapshot — quickly verify there are no critical risks (pledge, very high debt, negative OPM) before going deeper.
Combining Investment Analysis with Other Sub-Tabs
| Scenario | What to Check Next |
|---|---|
| HOLD score but "Bottom of range" PE | Business is average quality but historically cheap — check Valuation tab for PEG and Reversed DCF to see if the price already implies growth acceleration |
| BUY score but "Top of range" PE | Great business but priced for perfection — check Quick Analysis for recent momentum; a high-quality business at a stretched PE still carries multiple compression risk |
| Pledge% > 0% in Financial Health | Immediately check the Ratios tab for the exact pledge figure and trend; check Forensics sub-tab if available for governance red flags |
| Risk Factor: "Poor sales growth" | Go to Quick Analysis → Growth CAGR section to see if recent quarters show acceleration that the 5-year figure is masking |
| Catalyst: "Capex to Depreciation — Excellent" | This means the company is investing more than it depreciates — it is growing its asset base. Verify this in Financials → Cash Flow statement (capex line) |
Ready to Analyse Indian Stocks Like a Pro?
Finmagine gives you 30+ computed financial ratios, sector benchmarks, FII/DII flows, the Finmagine Score, and AI-powered analysis — all in one place.