Following along? Open the live page
Finmagine — free to explore • premium for full access • no app needed
1. What the Forensics Sub-Tab Does
The Forensics sub-tab is a quantitative early-warning system. It applies 6 objective signals to 5 years of financial data and surfaces concerns that might not be visible from a single year's P&L. It does not replace deep-dive research — but it tells you where to look first.
The signals are deliberately simple to compute, using only verified data already in the platform (Cash Flow, P&L, Balance Sheet, Ratios). This makes them consistent across all companies and reproducible over time.
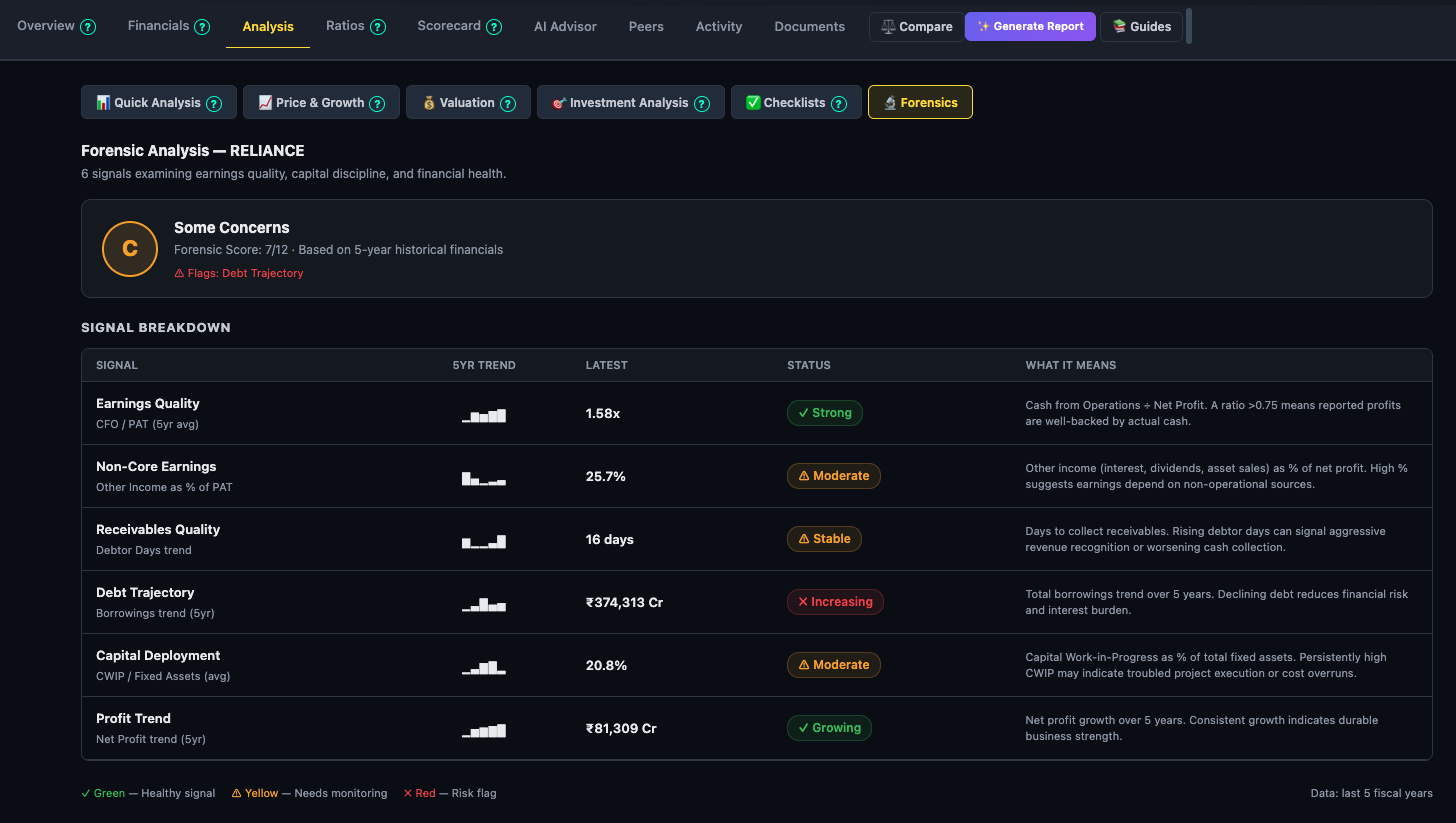
What each column means in the signal table
| Column | What it shows |
|---|---|
| Signal | Signal name and the underlying metric being measured (e.g. "CFO / PAT (5yr avg)") |
| 5-Yr Trend | Sparkline of annual values oldest → newest. Hover for year labels. |
| Latest | The most recent annual value for the metric |
| Status | Green / Yellow / Red chip with a label (e.g. Strong, Moderate, Increasing) |
| What It Means | One-line explanation of what the signal is testing and why it matters |
2. The Overall Grade (A / B / C / D)
Above the signal table, a circular grade badge summarises the 6 signals into a single A–D rating. The scoring is: Green = 2 pts, Yellow = 1 pt, Red = 0 pts per signal. Maximum possible score is 12.
The Red Flags line below the grade badge lists the names of any signals that scored red (0 pts). These are the highest-priority items to investigate — a company can have a B overall but one specific red flag that matters a great deal for a particular sector or thesis.
3. Signal 1 — Earnings Quality (CFO / PAT)
This is the single most important forensic signal. A company reports profit on an accrual basis — revenue is recognised when earned, not when cash arrives. A company could show ₹100 Cr net profit while only collecting ₹30 Cr in actual cash. The CFO/PAT ratio checks whether the reported profit is supported by real cash generation.
- ≥ 0.75x (Strong): For every ₹1 of reported profit, the company generates at least ₹0.75 in operating cash. Healthy and sustainable.
- 0.40–0.74x (Moderate): Cash conversion is below ideal but not alarming. Common during high-growth phases when working capital is expanding rapidly.
- Below 0.40x (Weak): Reported profits are substantially backed by receivables or non-cash items rather than real cash. Investigate the working capital trend and revenue recognition policy.
4. Signal 2 — Non-Core Earnings %
"Other Income" on the P&L includes interest received on cash deposits, dividends from subsidiaries, foreign exchange gains, and profits from asset sales. These are legitimate income sources — but they are non-recurring and non-operational. A business that relies heavily on other income to make its profit numbers is not as strong as one that generates profit purely from selling its products or services.
- Below 15% (Low): Other income is a minor supplement to operational profit. Business earnings quality is high.
- 15–34% (Moderate): Other income is meaningful. Check what it consists of — sustained treasury income from a cash-rich balance sheet is less concerning than one-time asset sale gains.
- ≥ 35% (High): More than a third of net profit comes from non-operational sources. If the core business slows, the reported profit will fall disproportionately. The operational PAT is materially lower than the headline PAT.
5. Signal 3 — Receivables Quality (Debtor Days Trend)
Debtor Days (also called Days Sales Outstanding) measures how many days on average it takes for the company to collect cash after a sale. A company booking revenue on credit but collecting slowly can show strong top-line growth while actually accumulating a receivables problem.
- Falling trend (Improving): The company is collecting cash faster than before — customers are paying sooner, or credit terms have tightened. Revenue quality is improving.
- Flat (Stable): Collection efficiency is unchanged. Not a concern unless the absolute level is high for the sector.
- Rising trend (Rising): Collections are deteriorating. This can indicate: customers under financial stress; aggressive revenue recognition (booking sales that will be disputed or returned); or the company extending longer credit to win business it otherwise couldn't. Any rising trend is worth investigating.
6. Signal 4 — Debt Trajectory
Debt is not inherently bad — a company borrowing to build capacity at high ROCE is creating value. But a company where borrowings are consistently rising without matching growth in profitability is building financial risk. This signal tracks the direction of total borrowings (short-term + long-term) over 5 years.
- Deleveraging (Falling): The company is paying down debt — reducing interest burden and financial risk. Often a sign of strong free cash generation exceeding capex needs.
- Stable: Debt is being maintained at a consistent level. Acceptable if profitability is also growing (effective deleveraging by growing the denominator).
- Increasing: Borrowings are growing. Not automatically bad — check if capex is expanding capacity, and whether ROCE on the new capital is expected to be above the cost of debt.
7. Signal 5 — Capital Deployment (CWIP %)
Capital Work-in-Progress (CWIP) is the balance sheet value of fixed assets under construction — projects that are not yet complete and therefore not yet generating revenue. A single large CWIP year is normal during a capacity expansion. Persistently high CWIP across five years suggests capital is stuck in long-duration projects that have not been converted to productive assets.
- Below 15% average (Low): Capital is being deployed and commissioned efficiently. Projects are completing and contributing to the asset base.
- 15–29% average (Moderate): Meaningful capital is under construction. Acceptable for infrastructure or manufacturing companies in a multi-year expansion phase.
- ≥ 30% average (High): A large proportion of the fixed asset base has been sitting in CWIP on average over 5 years. Risk of cost overruns, execution delays, or capital trapped in projects that may need to be written down.
8. Signal 6 — Profit Trend
The simplest of the six signals — is the company more profitable now than it was five years ago? This is a directional check, not a CAGR calculation. The threshold is a 15% move over the full 5-year period (not per year), so this signal is designed to catch only genuine multi-year improvement or deterioration, not short-term volatility.
- Growing: Net profit is materially higher today than five years ago. The business has grown in earning power — the most basic test of a healthy business.
- Flat: Profit has been roughly unchanged over 5 years. Not necessarily bad — cyclical businesses (chemicals, metals) often show flat long-term profits with volatility. Check the Price & Growth sub-tab for cyclical patterns.
- Declining: Net profit is materially lower than 5 years ago. The business has shrunk in earning power — could be structural (competitive pressure, disruption) or cyclical (deep down-cycle). Understanding which is the most important analytical question.
9. How to Read Forensics in Practice
The two-signal pairs that matter most
| Pair | Both Green → conclusion | One Red → investigate |
|---|---|---|
| Earnings Quality + Profit Trend | Company is growing real cash profits — the strongest combination | Growing profits without cash (red EQ): accounting quality issue. Strong EQ with declining profit: business shrinking even on a cash basis. |
| Debt Trajectory + CWIP % | Deleveraging with low CWIP: capital is deployed, productive, and being paid down | Rising debt + High CWIP: capital is being raised and deployed but not yet generating returns — check project timelines and expected ROCE. |
| Receivables + Non-Core Earnings | Stable/improving receivables + low other income: revenue is clean and collected promptly | Rising receivables + high other income: top-line may be inflated, and headline profit is partly from treasury — the operational picture is weaker than it appears. |
Sector context for interpreting grades
| Sector | Signals that will naturally skew yellow/red | What to focus on instead |
|---|---|---|
| Banks & NBFCs | Earnings Quality (CFO/PAT structure is different) | Debt Trajectory, Non-Core Earnings, Profit Trend |
| Infrastructure / Power / Telecom | CWIP % (multi-year build cycles), Debt Trajectory (project financing) | Earnings Quality, Receivables Quality, Profit Trend direction |
| Holding companies / Conglomerates | Non-Core Earnings (dividends from subsidiaries) | Consolidated P&L trend, Debt Trajectory at the consolidated level |
| FMCG / Consumer / IT | All 6 signals are directly applicable — no structural exceptions | Run all 6 signals at face value; expect mostly green for quality names |
Ready to Analyse Indian Stocks Like a Pro?
Finmagine gives you 30+ computed financial ratios, sector benchmarks, FII/DII flows, the Finmagine Score, and AI-powered analysis — all in one place.