Following along? Open the live page
Finmagine — free to explore • premium for full access • no app needed
What the Technicals Sub-Tab Shows
The Technicals sub-tab sits within the Analysis tab on every stock page. It provides a snapshot of the stock's current price momentum, volatility, trend structure, and key price levels — computed daily from market data. It is deliberately compact: four components, all signal-focused, designed to give you a technical read in under two minutes.
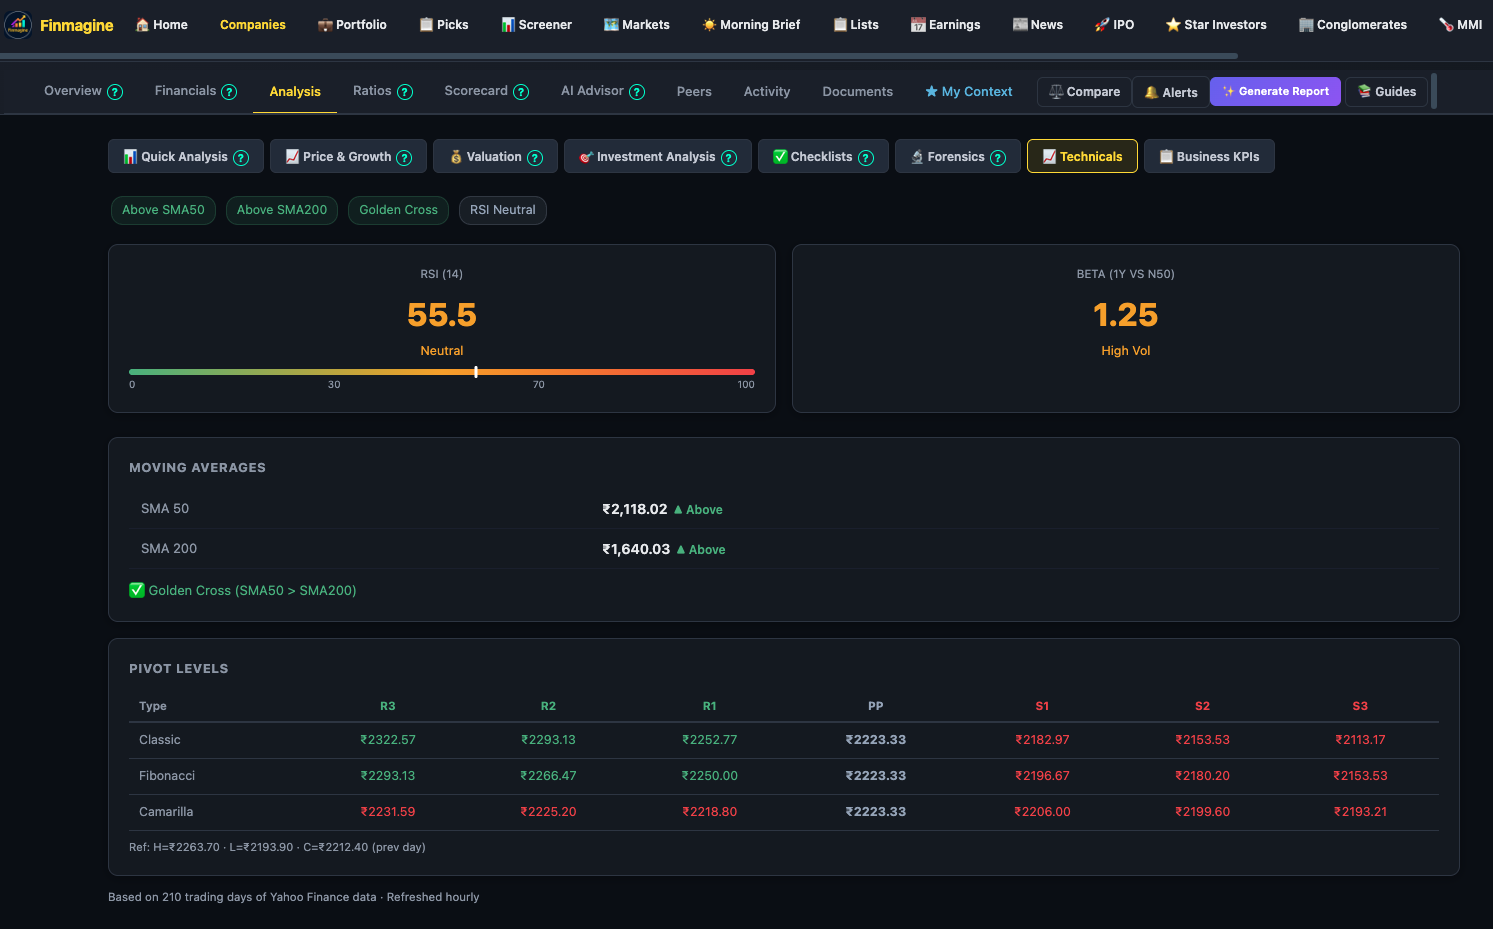
The four components, top to bottom:
- Signal chips — four at-a-glance tags summarising the current technical posture
- RSI (14) — momentum gauge with oversold / neutral / overbought zones
- Beta (1Y vs N50) — stock volatility relative to Nifty 50 over 1 year
- Moving Averages — SMA50 and SMA200 with Above/Below status and Golden/Death Cross detection
- Pivot Levels — Classic, Fibonacci, and Camarilla resistance and support grid
Signal Chips — The At-a-Glance Summary
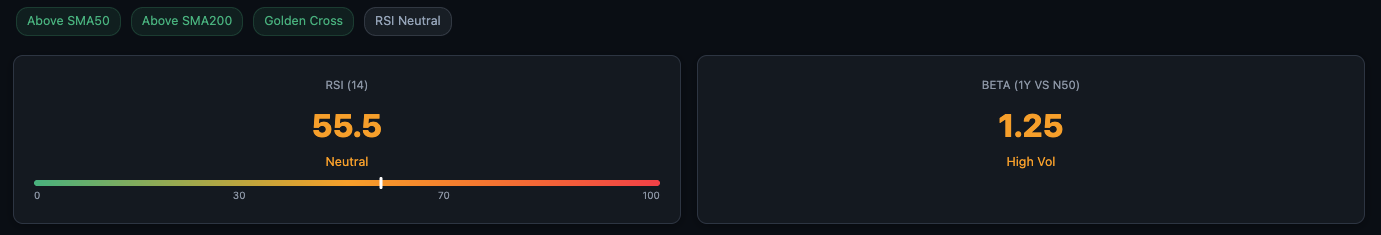
The four chips at the top of the Technicals sub-tab condense the full technical picture into one scannable row. Green chips are bullish signals; red chips are bearish; neutral chips are context-dependent.
Bullish example (ACUTAAS Chemicals):
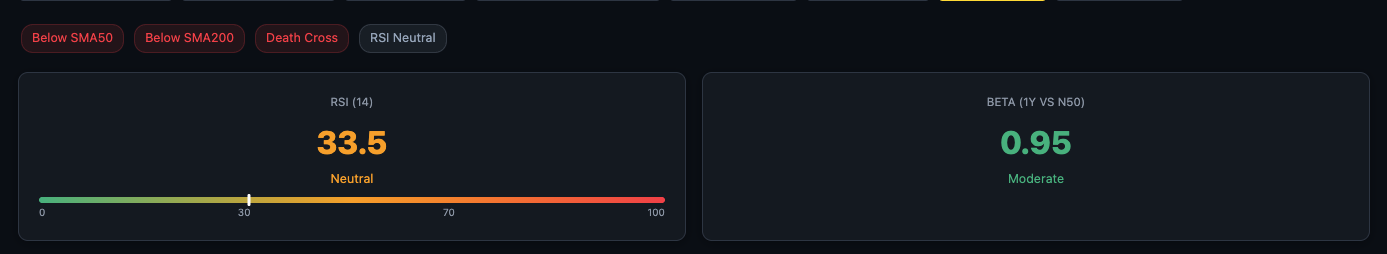
Bearish example (Reliance Industries):
The chips are not four independent signals — they are a system. Three greens and one red tell a very different story from three reds and one green. Read the combination, not individual chips in isolation.
RSI (14) — Momentum Gauge
The Relative Strength Index (RSI) measures the speed and magnitude of recent price changes on a 0–100 scale. The 14-period version — the most widely used — averages gains and losses over the last 14 trading days to produce a single momentum reading.
Three zones:
- 0–30 (Oversold) — selling pressure has been excessive. Price may be stretched to the downside. In a strong downtrend, RSI can remain below 30 for weeks — it is a caution zone, not an automatic buy signal.
- 30–70 (Neutral) — normal momentum range. Most stocks spend most of their time here. Within this band, a rising RSI indicates building strength; a falling RSI indicates weakening momentum.
- 70–100 (Overbought) — buying pressure has been excessive. Price may be stretched to the upside. In a strong uptrend, RSI can stay above 70 for extended periods — particularly in high-momentum stocks.
Beta (1Y vs N50)
Beta measures how much the stock moves relative to the Nifty 50 index over the past year. It sits alongside RSI in the same card row.
- Beta > 1.5 — High Volatility — the stock amplifies index moves significantly. Larger potential gains in bull markets; sharper drawdowns when markets fall.
- Beta 1.0–1.5 — Moderate-High — moves somewhat more than the index.
- Beta 0.5–1.0 — Moderate — broadly tracks the index with lower volatility.
- Beta < 0.5 — Low Volatility — defensive characteristic, common in FMCG, pharma, and utilities.
ACUTAAS shows Beta of 1.25 (High Vol) — in a Nifty bull run this stock will likely move faster. Reliance shows Beta of 0.95 (Moderate) — it broadly tracks the index and is less susceptible to sharp swings.
Moving Averages — Trend Structure
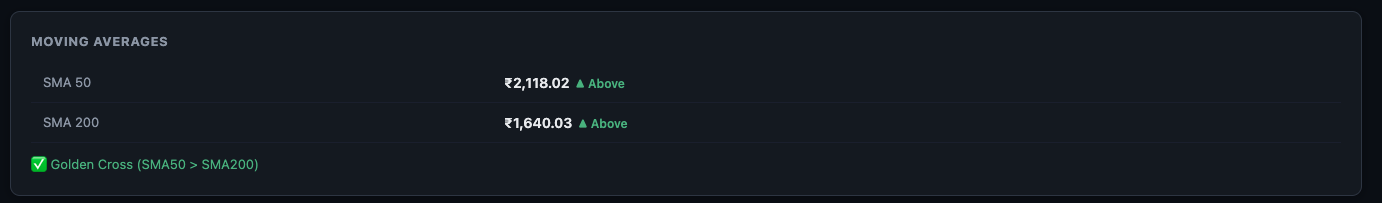
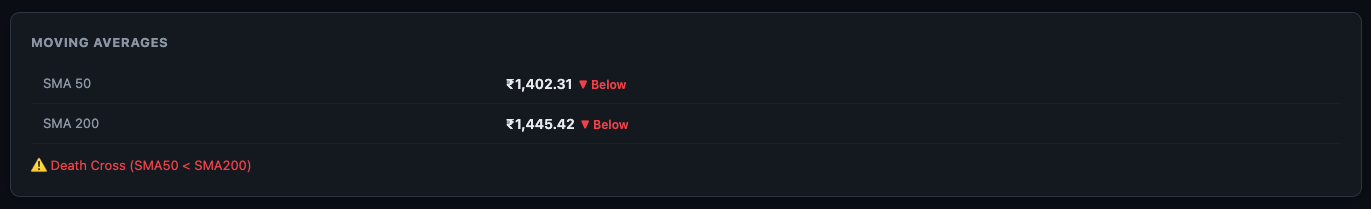
The Moving Averages section shows the current values of the SMA50 (50-day Simple Moving Average) and SMA200 (200-day Simple Moving Average), each with an Above / Below status indicator relative to the current price. Below the two values, a cross detection line shows whether a Golden Cross or Death Cross is active.
What Each Moving Average Tells You
- SMA50 (50-day) — the medium-term trend. Traders use it as a near-term support/resistance level. A stock consistently bouncing off SMA50 in an uptrend is showing healthy pullback behaviour. A stock that can no longer hold SMA50 is weakening.
- SMA200 (200-day) — the long-term trend. The single most widely watched moving average by institutional investors globally. Price above SMA200 = long-term uptrend intact. Price below SMA200 = the stock is in a longer-term downtrend or correction.
Golden Cross vs Death Cross
| Event | What Happens | Interpretation | Example |
|---|---|---|---|
| ✅ Golden Cross | SMA50 crosses above SMA200 | Medium-term momentum has shifted bullish. Short-term trend now leading long-term. Institutional buying signal. | ACUTAAS — SMA50 ₹2,118 > SMA200 ₹1,640 |
| ⚠️ Death Cross | SMA50 crosses below SMA200 | Short-term trend has deteriorated below the long-term trend. Institutional selling signal. Can persist for months. | Reliance — SMA50 ₹1,402 < SMA200 ₹1,445 |
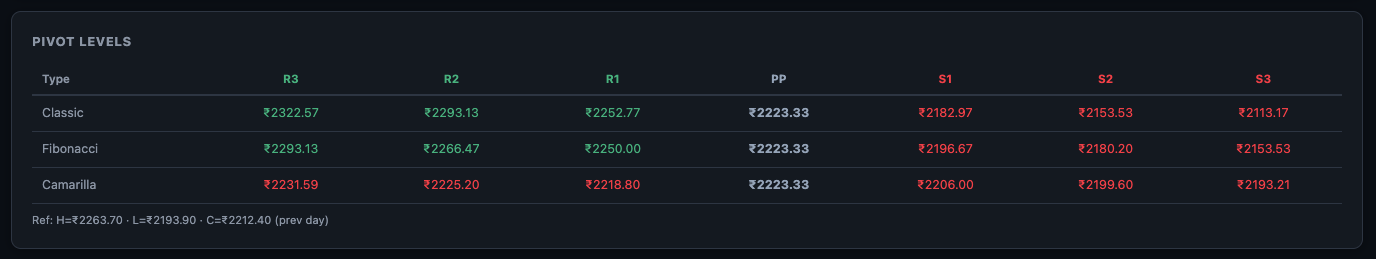
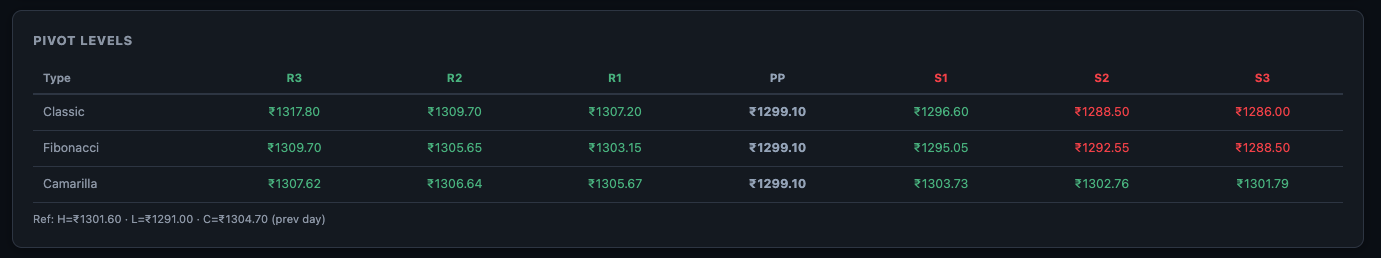
Pivot Levels — Support & Resistance Grid
The Pivot Levels table provides a structured grid of support and resistance levels calculated from the previous day's High, Low, and Close. Three methods are shown — Classic, Fibonacci, and Camarilla — each calculating levels differently from the same base data. The reference values are shown at the bottom of the table: Ref: H · L · C (prev day).
Understanding the Level Structure
- R1 — first resistance above PP. Most commonly tested intraday.
- R2 — second resistance. A break above R1 often targets R2.
- R3 — strong resistance. Reaching R3 intraday usually indicates high momentum.
- S1 — first support below PP. Common bounce zone intraday.
- S2 — second support. A break below S1 often tests S2.
- S3 — strong support. Reaching S3 intraday indicates heavy selling pressure.
Pivot Point (PP) = (High + Low + Close) ÷ 3. This is the fair value anchor for the session. Price trading above PP suggests bullish bias for the day; price below PP suggests bearish bias.
The Three Methods — Which to Use
- Classic — the original pivot formula. Uses fixed arithmetic multipliers applied to the prior day's range (High − Low). Widely used by retail traders and widely respected because it is widely known — levels that many traders watch tend to become self-fulfilling.
- Fibonacci — applies Fibonacci ratios (23.6%, 38.2%, 61.8%, 100%) to the prior day's range from PP. Preferred by traders who use Fibonacci retracements elsewhere in their analysis — the levels align with the same framework.
- Camarilla — uses tighter levels calculated as fractions (1/12th) of the prior day's range. The levels cluster much closer to PP than Classic or Fibonacci. Particularly useful for intraday mean-reversion strategies — Camarilla R3 and S3 are key reversal zones where price is expected to snap back rather than break through.
Combining Technicals with Fundamental Analysis
The power of the Technicals sub-tab on Finmagine is not in the indicators themselves — any charting platform shows RSI and moving averages. The power is that you arrive at the Technicals sub-tab already knowing whether the underlying business is worth owning. The technical picture then tells you whether now is a reasonable time to act on that conviction.
Step 1 Confirm the business first — use Financials, Ratios, and Scorecard. If the company doesn't pass your fundamental filter, the technicals are irrelevant.
Step 2 Check the structural posture — is the stock above SMA200? Is a Golden Cross active or has a Death Cross recently formed? This tells you the trend structure of the price, independent of your fundamental view.
Step 3 Read RSI in context — a fundamentally strong stock with RSI approaching 30 is a classic accumulation opportunity. The same RSI reading on a fundamentally weak stock may simply reflect a business in terminal decline.
Step 4 Use pivot levels for entry sizing — if you've decided to buy, check whether the current price is near S1 or S2. These structured support zones improve the risk-reward of your entry relative to buying at PP or above.
Step 5 Note Beta for position sizing — a high-Beta stock requires a smaller position size than a low-Beta stock to deliver the same portfolio volatility. Beta is the input to position sizing, not a reason to avoid or prefer a stock.
Ready to Analyse Indian Stocks Like a Pro?
Finmagine gives you 30+ computed financial ratios, sector benchmarks, FII/DII flows, the Finmagine Score, and AI-powered analysis — all in one place.